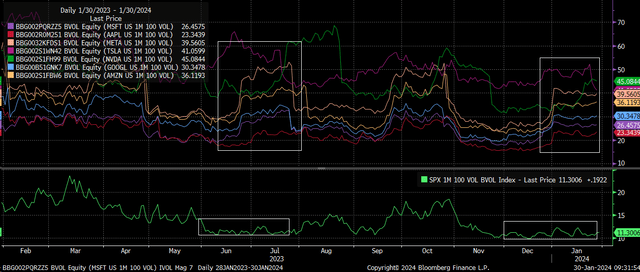
The volatility dispersion trade is hard at work, and it’s coming to a point in the cycle where we should see it begin to break down, as was the case over the summer months following the completion of earnings season.
It’s when options’ hedging flows are weak, given that we are between the January and February options’ expiration dates. This is similar to July and August when we saw a big lower turn in markets, which turned into a sharp decline.
A Window Is Still Open
As mentioned about two weeks ago, the window for a significant market decline was open, and it will remain open, which means that if a decline does develop, as expected, it could be a pretty brutal sell-off into February opex and perhaps even into the middle of March.
The big thing here is how the market is lining up and how earnings for the Magnificent 7 come into play. As the theory goes, traders of the implied volatility dispersion trade sell index volatility on the S&P 500 and hedge those short positions by buying implied volatility of the index’s components.
Heading into earnings season, this trade appears to work well, as noted by the rising implied volatility of stocks starting around one month before a company’s results. Such was the case in July, as implied volatility in the Magnificent Seven stocks all rose, as the implied volatility of the S&P 500 sank. This same trade developed more recently, around the middle of December.
Bloomberg
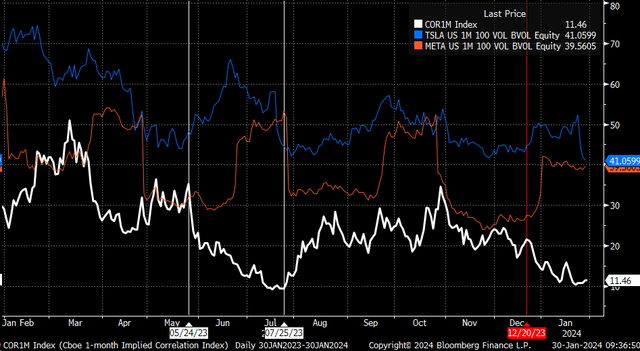
The decline can be seen in the 1-month implied correlation index, which took a notable turn lower around the time the Tesla 1-month 100% moneyness options implied volatility turned higher at the end of May, while the index took a notable turn higher when Meta’s Implied volatility turned lower at the end of July. The same process is now underway, with Tesla (TSLA) and Meta’s (META) implied volatility and the other five stocks rising sharply in the middle of December as the S&P 500 implied volatility and correlation index turned lower.
Bloomberg
This would suggest that as the implied volatility falls for stocks in the Magnificent Seven following their results, as they normally do, the implied volatility of the S&P 500 should turn higher, and implied volatility overall should begin to become more correlated again, pushing the implied correlation index higher, just as did at the end of July.
This, in turn, tells us that implied volatility could remain high for the S&P 500 or go higher into the next earnings cycle, which may not start again until around or after the March option expiration date. At that point, implied volatility for stocks would begin to rise, and the selling of implied volatility for the index could once again commence.
The Caveat
The one caveat is the October to November earnings season. But one must remember that implied volatility on the index level was already high in October due to tensions in the Middle East. So, even though implied volatility on individual stocks increased, we didn’t see implied volatility on the S&P 500 fall until after the start of November.
Continued Strength Ties Together
All of this ties together and suggests why we have seen continued bids in the group of 7 stocks, or more recently, the troubling three. This has had much to do with delta hedging flows heading into the January options expiration date, the supportive flows from volatility selling, and the hedging positions in these names as well.
So, the window is still very much open. The mechanics of implied volatility and hedging flows have helped to prop markets up, and there’s a good chance it is nothing more than that.
Read the full article here


