Stocks skyrocketed on Tuesday, and financial news outlets were quick to attribute the report to the morning’s CPI report. The S&P 500 (SPY) is now up approximately 10% in about two weeks– a typical year’s worth of gains. But if you go and read the actual October CPI report, it’s not that great. Services inflation remains red-hot, clicking along at 5.5% annually. Restaurant prices continue to rise at 5.4% annually. Used car prices are falling and helping CPI greatly, but they’re coming off of the highs of the pandemic used-car bubble. The real reason that stocks surged nearly 10% in about two weeks is that the Fed is done hiking.
How do we know this? Because journalists with close connections to the Fed have said so. Should the Fed hike more? I’d strongly argue that they should hike at least once more from the data I have. Will they? Almost certainly not.
The October payroll report and inflation report strongly suggest the Fed’s last rate rise was in July. The big debate at the next Fed meeting is shaping up to be over whether and how to modify the postmeeting statement to reflect the obvious: the central bank is on hold.
–Wall Street Journal reporter Nick Timiraos, via Twitter (X) on November 12.
A little background on the WSJ‘s Nick Timiraos– he’s the chief economics correspondent at the WSJ and wrote Jerome Powell’s biography, Trillion Dollar Triage. To my knowledge, he’s never been wrong on this kind of scoop. And you wouldn’t ever be wrong if you had close contacts at the Fed who could tell you what they’re thinking. I would argue that Timiraos’ tweet and subsequent WSJ article were the true catalysts sparking a sea change in Fed funds futures and stocks, with billions of dollars in bets on further hikes being erased in hours. The crazy thing is that the real insiders on Wall Street probably knew this before–perhaps as soon as the end of October when stocks started to take off. This knowledge would give them the ability to buy stocks before the trading frenzy. As far as I know, this is 100% legal, underscoring the huge informational advantage that big-money traders in New York and DC have over the public.
If you read the October CPI report, the data truly is up for interpretation. Inflation is still far too high. If you run econometric models, most of them still tell you to hike one or two more times. But people at the Fed are tacitly saying they’re not going to hike anymore, and that makes all the difference in the world to those trading Fed funds futures.
Now traders are further piling into bets on deep cuts to the Fed funds rate, which is probably too optimistic, given what we already know about the mixed inflation data. Current CME data shows the market expects four rate cuts by the end of 2024, with the first coming as soon as March.
But A Fed Pause Doesn’t Make Stocks Cheap
Mechanically, the move in the market Tuesday was exactly what you would expect. If you run a regression on the long-term relationship between interest rates and stocks, you’ll find that each 0.25% hike in interest rates should push stocks down by a little over 1%. Conversely, each 0.25% cut should push stocks up by a little over 1%. This isn’t an exact science but it also makes sense from a theoretical perspective. To have the same excess return in stocks when interest rates go up, P/E multiples need to shrink, and using a change in price of a little over 1% for each 0.25% in interest rates is a good rule of thumb.
Using this framework, over half of Tuesday’s move in the market was purely mechanical. However, from an overall valuation perspective, the Fed has hiked about 22X 0.25% since rates bottomed during COVID, meaning stocks should theoretically be down around 25% since the 2021 highs. However, multiples for stocks have barely budged in spite of a huge change in interest rates. The bond market priced almost all of the change in interest rates– for example with the iShares 20+ Year Treasury ETF (TLT) falling over 50% from its highs. Stocks never really priced this, which is unsettling if you’re buying stocks for the long term. You’re not earning much more than cash now in terms of expected long-run return.
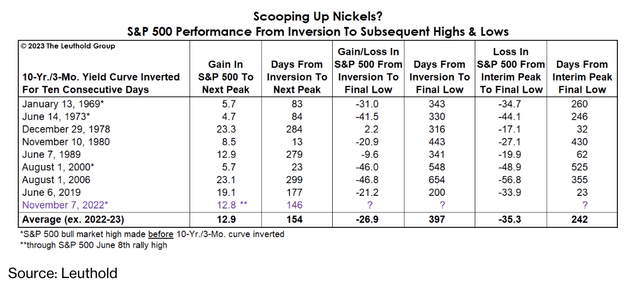
Something else important to note is to look at the history of Fed pauses and the big late-cycle rallies they tend to cause. History shows that when the yield curve inverts as it did last November, stocks initially tend to rally hard, anywhere from 10-20% in 6-12 months. In the typical business cycle (including the past five business cycles), the yield curve inversion has also been accompanied by a Fed pause.

The Business Cycle In Action (Leuthold via Bloomberg)
Next, what you see is a recessionary bear market with an average loss of 35.3%. The Fed cuts rates but the business cycle has already turned. Many investors believe that the government has legislated away the business cycle and that we’ll never have another recession, stock market crash, or rise in unemployment. The truth is that the government can’t control the business cycle, at least not without the negative long-term consequences outweighing the good. Indeed, the most anticipated recession in history is still coming. Massive government spending won’t prevent it– in fact, since much of the fiscal policy is to build redundancy in the economy and is blocking free trade, it’s likely to make the business cycle worse. Moreover, consumers have come to excessively rely on the government, bringing personal savings rates down to near-record lows. This will also exacerbate the business cycle.

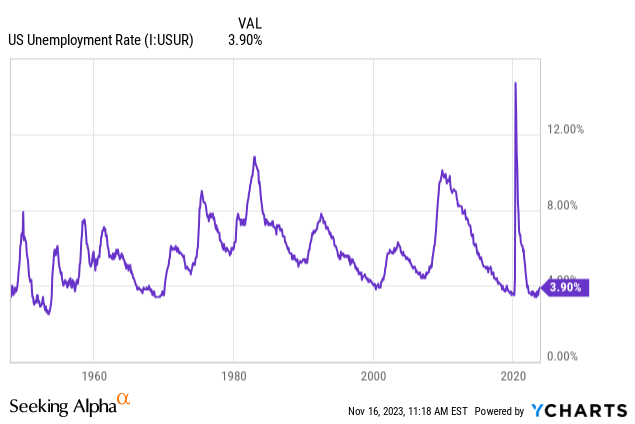
Now you can match up each of these Fed pauses with changes in the unemployment rate. If you ignore the extreme anomaly from COVID, you see that unemployment rose sharply in the past five cycles– slowly at first and then picking up sharply.
This is where we may find the story (quietly rising unemployment) behind the story (the Fed pausing interest rate hikes). Today’s jobless claims numbers came in, and the leading indicators coming out of it are very interesting. We’re seeing hiring quickly slowing. At first glance, there’s nothing too alarming with the jobless claims numbers, with 231k jobless claims for the week. But beneath the surface, we see continuing jobless claims rising at a pace of 30,000 people week-over-week. Unemployment bottomed out at 3.4% and it’s up to 3.9%. Can you find any historical points where unemployment was at a low level, rose 0.5% or more, and then reversed? There aren’t any. Extrapolating the continuing jobless claims number rising at a little over 32,000 people per week, you get about 1.66 million people more unemployed in 12 months. Past business cycles are largely driven by slowing hiring, not huge layoffs. This shouldn’t be any different, and it implies an unemployment rate of over 5% by this time next year. The third monthly student loan payment for millions of borrowers is due at the end of the month, cutting into consumer demand before the key holiday season.
If the Fed cuts rates it won’t fix things– it’ll actually decrease corporate profits for the first two years or so, possibly driving more layoffs. In reality, once unemployment starts to rise it tends to pick up pace, we’re now seeing this in Europe. My guess is that we end this business cycle with an unemployment rate of 7.5% or higher– not as bad as the 2008 recession but as bad or worse than when the cycle turned in 1989 and 2000.
There’s a very strong correlation between valuations for stocks and property and the unemployment rate. Record-high stock valuations only make much sense in the context of record-low interest rates and record-low unemployment. When inflation forced interest rates up, that removed the first driver. Stubborn inflation and rising unemployment could result in a historically normal economy where the cash rate might be 2.5% or so and unemployment is 6%– yet the S&P 500 is below 3000.
You have to put crazy valuations for stocks in historical context. Just because stocks go up doesn’t make them expensive. In fact, stocks going up is perfectly normal. But when prices consistently rise faster than underlying earnings, and the underlying earnings themselves are boosted by unsustainable government policies as they have been since 2019, it’s inevitable that the pendulum will swing the other way.
Bottom Line
The S&P 500 is trading for about 21x peak earnings as of my writing this. There’s simply not much precedent for it. Over the past 125 years, America has gone from horse-and-buggies and farms to skyscrapers and airplanes. The best returns came not from the times when the public loved stocks, but from the times when everyone hated them. With perfect foresight, research shows the best overall investment you could have made was in cigarette companies. Countless dollars have been lost chasing the hot new trends and paying massive valuations. A few years ago it was cannabis and sports betting, then COVID vaccine stocks, and now AI and weight-loss drugs. Also during this time, buy-and-hold investors did great so long as they avoided buying at bubble peaks (the late 1960s, late 1990s, early 2020s?). The Fed is in all likelihood done hiking interest rates here. But if you dig into stock valuations, they generally still aren’t making much sense. While the market move after the Fed news trickled out was perfectly rational in the short run, history shows that the economy and stock market are about to change.
Read the full article here


