
Thesis
In the complex landscape of Tesla, Inc. (NASDAQ:TSLA) valuation, a thorough exploration of various scenarios reveals intriguing prospects for investors. As we calculate an average fair value of $251.5, closely mirroring the current stock price of $260.5, it suggests that Tesla is presently trading at a fair valuation. However, delving into future values, a price of $473.5 emerges, promising an annual return of 16%. This underlines the dynamic nature of Tesla’s potential, with the first scenario taking into account a remarkable 30% revenue growth rate and the possibility of an annual return soaring as high as 22%. Amidst this multifaceted valuation analysis, Tesla’s investment landscape remains both captivating and enigmatic.
Overview
Tesla in the Future
Tesla’s charging network ranks as the second largest in the U.S., trailing only behind ChargePoint (CHPT). The latter boasts a network of 56,000 chargers, with approximately 96% being level 2 ports, while the remainder are level 3. Tesla, on the other hand, operates around 33,000 locations. Nonetheless, Tesla dominates the level 3 charger segment in the U.S., commonly referred to as “superchargers.” It’s anticipated that the electric vehicle (“EV”) charging network market can grow at a rate of 36%.
Author’s Calculations with base on Fortune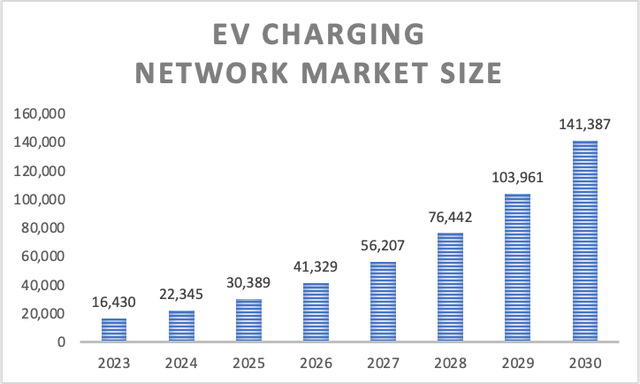
Many anticipate that insurance could become one of Tesla’s most substantial revenue streams in the future, potentially accounting for 30% of the company’s profits. Tesla’s foray into insurance faced a rocky start, as some may recall the website crashing on the day of its launch. Additionally, monthly premiums are determined using a “safety score” calculated by analyzing data collected from Tesla vehicles. Factors such as aggressive turns, speed, and adherence to traffic signals contribute to this score. Allegedly, an average score can yield a discount of around 20-30%, while an excellent score can result in a discount of approximately 30-60%. Some analysts project that this sector could generate $250 billion in insurance revenue. However, it’s worth noting that the car insurance market is expected to grow at a compound annual growth rate [CAGR] of 7.38%, which is an average from all the growth rates I found.
Tesla also offers products within its solar business, including Tesla solar panels, the solar roof, string inverters, and batteries. Globally, this sector is expected to experience a growth rate of 6.9% throughout 2029.
Author’s Calculations with base on many sources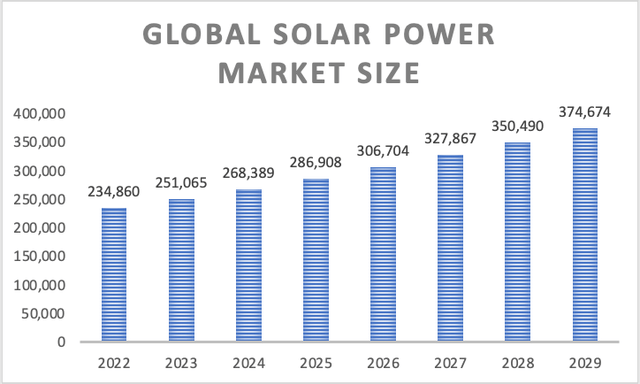
Tesla’s “falling margins”
Regarding Tesla’s “falling margins,” in my honest opinion, it was quite predictable to see Tesla reducing prices. Elon Musk’s primary goal when entering the Tesla venture was essentially to make electric vehicles an everyday mode of transportation. He envisions Tesla cars on the roads, driven by individuals, truck drivers, and even bus drivers. Therefore, it was foreseeable that Tesla’s objective would involve reducing production costs and consequently lowering sales prices.
Tesla’s Prices vs Margins (Electrek)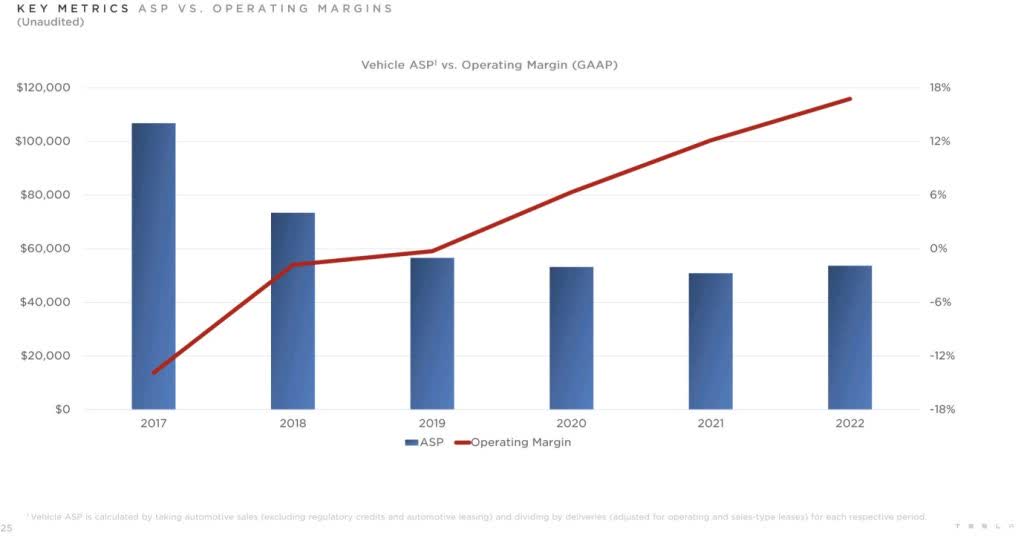
Tesla has effectively managed to reduce production costs, allowing the company to maintain high efficiency even as it cuts sales prices. Over the past five years, sales prices have been halved, and it is highly likely that Tesla will continue to lower prices in its pursuit of reaching the $25,000 mark in the next five years.
Tesla’s Reliability Problem
Tesla has consistently received low rankings in terms of reliability. A glance at the table below reveals that their reliability ratings have remained relatively stagnant over the past four years. However, it’s important to note that Tesla consistently earns high marks in customer satisfaction.
In my perspective, the most likely explanation for this lies in the extensive technology integrated into Tesla vehicles. Naturally, a greater amount of technology introduces the possibility of more issues compared to a more conventional vehicle like a Toyota Corolla or a similar model.
Top Speed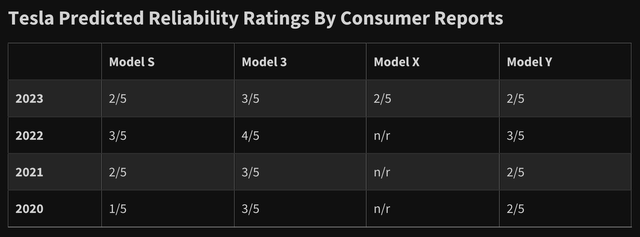
Setting aside the reliability concerns, Tesla EVs are renowned for their safety features. This, I believe, plays a pivotal role in consumers overlooking the reliability challenges and giving Tesla a chance. Teslas are often perceived as luxury vehicles, which further contributes to their appeal.
Financials
There are no surprises here, just what’s widely known: Tesla has experienced significant growth in recent years, with a particularly sharp rise during the pandemic. As illustrated in the table below, Tesla has achieved an impressive growth rate of 99% from 2017 to 2023.
Author’s Calculations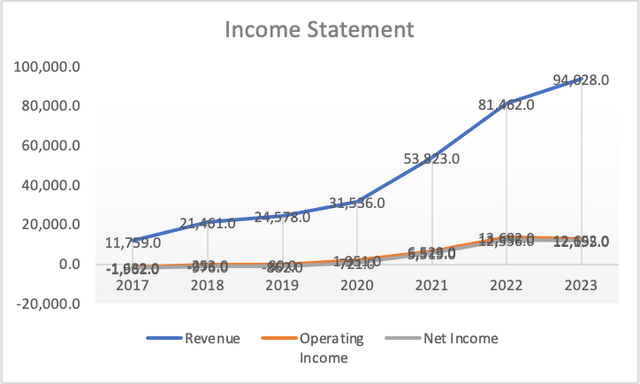
As mentioned earlier, Tesla’s profit margins have shown a consistent upward trajectory, currently exceeding 12%. Remarkably, this has been achieved despite production costs, indicating an overall increase in operational efficiency.
Author’s Calculations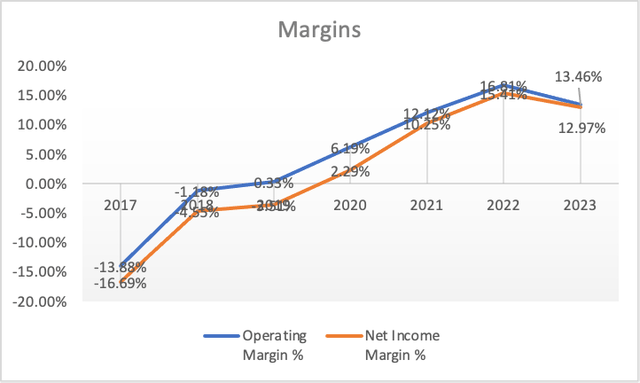
Tesla has nearly eliminated its long-term debt, leaving just $504 million in outstanding long-term debt. Additionally, it holds short-term debt of approximately $5.3 billion. However, these figures appear quite modest when compared to Tesla’s substantial cash balance, which currently stands at $23 billion.
Author’s Calculations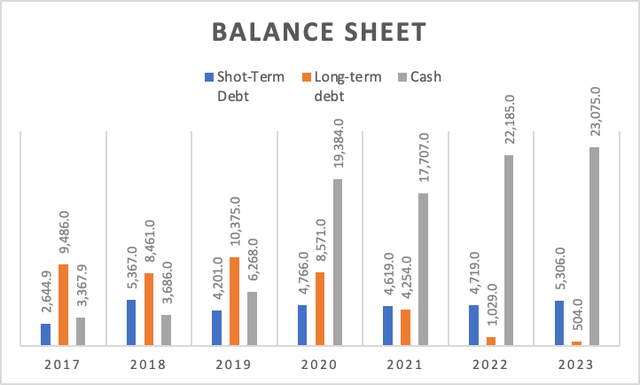
Moreover, Tesla’s free cash flow (“FCF”), currently at $5.1 billion, has dipped slightly from 2022’s $6.6 billion. The decline in free cash flow margin since its 2020 peak of 10% can be attributed to increased capital expenditures, suggesting that the company has a firm grip on its financial situation.
Author’s Calculations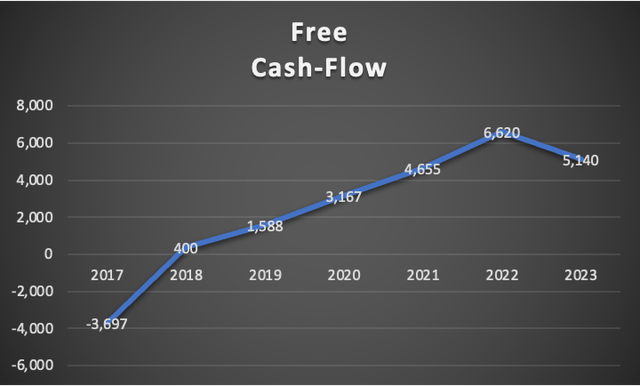
Author’s Calculations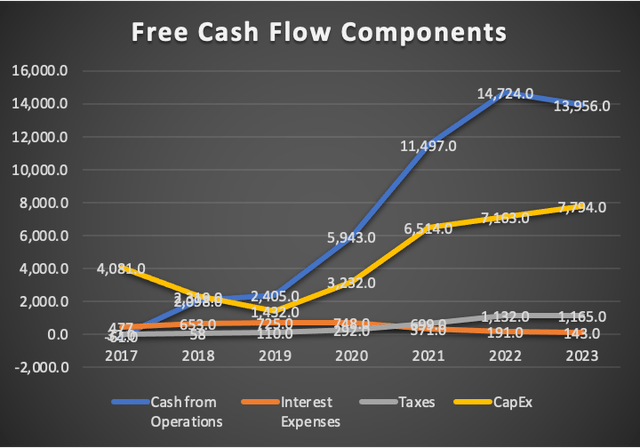
Author’s Calculations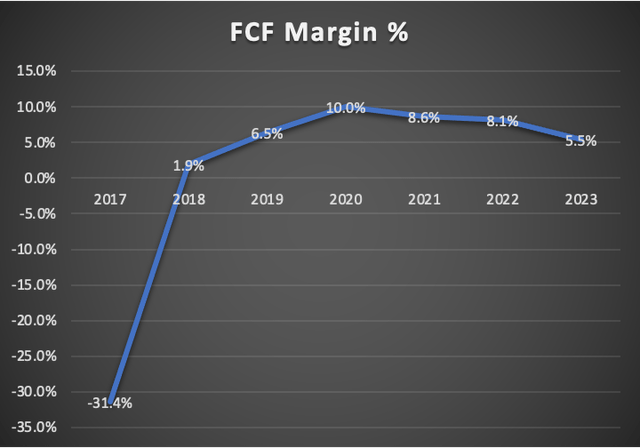
In summary, Tesla’s operating margins are exceptionally robust, and they have managed to enhance them while reducing sales costs, demonstrating confidence that lower costs will stimulate increased sales. Their balance sheet is in good shape, and their free cash flows remain strong in comparison to their peers in the sector.
Valuation
This valuation section encompasses three distinct scenarios. The first scenario is based on the revenue growth rate that analysts anticipate, estimated at 30%. The second scenario is an exceedingly optimistic one, relying on Elon Musk’s own vision for Tesla and the potential increase in the company’s value should Musk successfully achieve all of his objectives. The third and final scenario is a product of my own expectations regarding Tesla’s future.
Below, you will find a table of financial data, which, despite being labeled as “assumptions,” primarily comprises current financial information accessible on Seeking Alpha.
It’s noteworthy that the calculation of depreciation and amortization (D&A), interest expenses, and prospective capital expenditures is contingent on margins linked to revenue. This may be the sole “assumption” within this context, as Tesla retains the flexibility to either reduce or augment its capital expenditures, and the same applies to interest expenses should they opt to increase long-term debt. Additionally, from this table, the WACC will be calculated.
| TABLE OF ASSUMPTIONS | |
| (Current data) | |
| Assumptions Part 1 | |
| Equity Value | 51,130.00 |
| Debt Value | 5,810.00 |
| Cost of Debt | 2.46% |
| Tax Rate | 8.72% |
| 10y Treasury | 4.80% |
| Beta | 1.51 |
| Market Return | 10.50% |
| Cost of Equity | 13.41% |
| Assumptions Part 2 | |
| EBIT | |
| Tax | 1,165.00 |
| D&A | 4,145.00 |
| CapEx | 7,794.00 |
| Capex Margin | 8.29% |
| Assumption Part 3 | |
| Net Income | 12,195.00 |
| Interest | 143.00 |
| Tax | 1,165.00 |
| D&A | 4,145.00 |
| Ebitda | 17,648.00 |
| D&A Margin | 4.41% |
| Interest Expense Margin | 0.15% |
| Revenue | 94,028.0 |
30% Revenue Growth
The initial valuation scenario, as mentioned earlier, factors in Tesla’s anticipated revenue growth rate of 30%. This scenario, being the default revenue growth rate analysts predict, requires no additional elaboration.
| Revenue | Net Income | Plus Taxes | Plus D&A | Plus Interest | |
| 2023 | $99,670.0 | $12,289.31 | $13,360.95 | $17,754.66 | $17,906.24 |
| 2024 | $126,810.0 | $15,635.67 | $16,999.11 | $21,392.83 | $21,544.41 |
| 2025 | $164,853.0 | $20,326.37 | $22,098.85 | $29,366.00 | $29,616.71 |
| 2026 | $214,308.9 | $26,424.29 | $28,728.50 | $38,175.80 | $38,501.72 |
| 2027 | $278,601.6 | $34,351.57 | $37,347.05 | $49,628.54 | $50,052.24 |
| 2028 | $362,182.0 | $44,657.05 | $48,551.17 | $64,517.10 | $65,067.91 |
| ^Final EBITA^ |
| D&A Projection | Interest Projection | |
| 2023 | 4,393.714 | 151.58 |
| 2024 | 4,393.714 | 151.58 |
| 2025 | 7,267.151 | 250.71 |
| 2026 | 9,447.296 | 325.93 |
| 2027 | 12,281.485 | 423.70 |
| 2028 | 15,965.931 | 550.81 |
DCF1 (Author’s Calculations)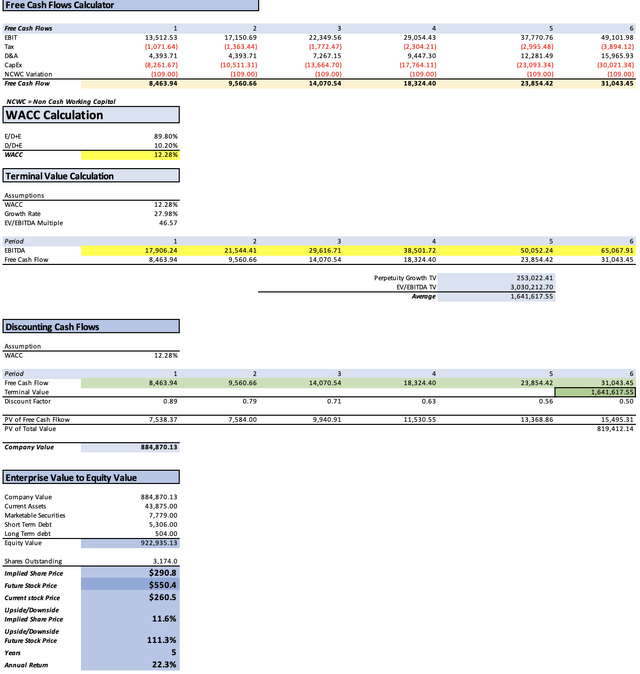
As evidenced by this discounted cash flow [DCF] analysis, it yields a current fair price of $290.8. This implies an 11.6% potential increase from the present stock price of $260.5. Furthermore, it indicates an annual return of 22.3% until the stock attains the suggested fair value of $550.4.
Tesla’s Master Plan Scenario
This scenario may appear entirely unrealistic to the majority, and I share the same skepticism. However, underestimating someone who possesses an unwavering determination to surpass their own lofty ambitions is not a prudent choice. The likelihood of them proving us wrong should not be dismissed.
As the subtitle suggests, this scenario essentially outlines the fulfillment of Tesla’s grand plans, projecting it as a $3.2 trillion corporation.
First and foremost, Tesla’s aspiration to offer $25,000 vehicles must be considered. In the table below, you will observe how Tesla could reduce its prices by 5.3% annually and the potential impact on car sales. It is worth noting that the average price cuts of 7.7% witnessed from 2019 to 2022 resulted in an average sales growth of 50.2%.
| Average Sales Price (In USD) | Units Sold (Thousands of cars) | Change in price % | Change in Units Sold % | |
| 2019 | 55.0 | 367.2 | -17.3% | 50.4% |
| 2020 | 48.0 | 499.0 | -12.7% | 35.9% |
| 2021 | 61.0 | 935.5 | 27.0% | 87.5% |
| 2022 | 58.0 | 1,313.86 | -4.9% | 40.4% |
| 2023 | 40.2 | 1,800.00 | -30.6% | 37.0% |
| 2024 | 38.1 | 4,400.00 | -5.3% | 144.4% |
| 2025 | 36.1 | 7,000.00 | -5.3% | 59.1% |
| 2026 | 34.1 | 9,600.00 | -5.3% | 37.1% |
| 2027 | 32.3 | 12,200.00 | -5.3% | 27.1% |
| 2028 | 30.6 | 14,800.00 | -5.3% | 21.3% |
| 2029 | 29.0 | 17,400.00 | -5.3% | 17.6% |
| 2030 | 25.0 | 20,000.00 | -13.7% | 14.9% |
Furthermore, in Tesla’s master plan, revenue projections for 2028 include an impressive $452 billion. The service and other segments, largely driven by insurance, are expected to reach a staggering $150 billion by 2028. This projection assumes that by 2026, revenue will reach $50 billion and subsequently grow by $50 billion annually. Additionally, the solar business is expected to maintain a revenue growth rate of 6.9%.
In the tables below, you will find detailed revenue expectations for each segment, followed by a comprehensive table of variables used in the EBITDA calculation.
| Sales of Vehicles | Service & Other | Solar | |
| 2023 | $72,432.0 | $7,243.0 | $5,112.0 |
| 2024 | $167,627.8 | $9,633.2 | $5,464.7 |
| 2025 | $252,479.8 | $12,812.1 | $5,841.8 |
| 2026 | $327,819.8 | $50,000.0 | $6,244.9 |
| 2027 | $394,420.1 | $100,000.0 | $6,675.8 |
| 2028 | $452,998.0 | $150,000.0 | $7,136.4 |
| Revenue | Net Income | Plus Taxes | Plus D&A | Plus Interest | |
| 2023 | $84,787.0 | $10,454.24 | $11,365.85 | $15,103.49 | $15,232.43 |
| 2024 | $182,725.7 | $22,530.08 | $24,494.71 | $28,232.35 | $28,361.29 |
| 2025 | $271,133.7 | $33,430.79 | $36,345.97 | $48,298.26 | $48,710.61 |
| 2026 | $384,064.7 | $47,355.17 | $51,484.57 | $68,415.14 | $68,999.24 |
| 2027 | $501,095.9 | $61,785.12 | $67,172.82 | $89,262.44 | $90,024.52 |
| 2028 | $610,134.4 | $75,229.57 | $81,789.63 | $108,685.95 | $109,613.86 |
| ^Final EBITA^ |
| D&A Projection | Interest Projection | |
| 2023 | 3,737.633 | 128.95 |
| 2024 | 3,737.633 | 128.95 |
| 2025 | 11,952.284 | 412.35 |
| 2026 | 16,930.574 | 584.09 |
| 2027 | 22,089.617 | 762.08 |
| 2028 | 26,896.318 | 927.91 |
DCF 2 (Author’s Calculations)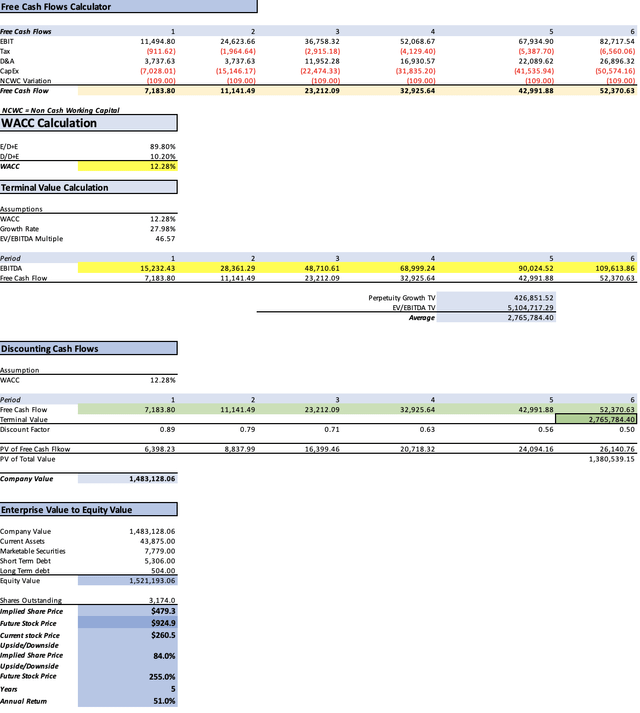
If Tesla can effectively realize its master plan, this would translate into a present fair price of $479.3, reflecting a remarkable 84% increase from the current stock price of $260.5. Furthermore, the future stock price of $924.9 would represent an impressive 255% upside from the current stock price, equating to an annual return of 51% over a five-year period.
My Estimates
As the subtitle suggests, these are my estimates for Tesla. The first step is to explore how price reductions impact final sales. As previously mentioned, it’s highly likely that Tesla will continue to lower prices until they achieve a $25,000 vehicle, essentially implying a further 50% reduction in prices over the next five years.
Electrek
Statista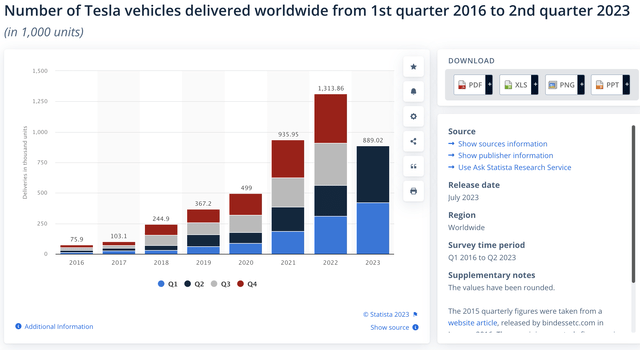
In the table below, I assume that Tesla will be selling $25,000 vehicles by 2030, resulting in annual price reductions of 5.3%. I then calculate the average price change, which equates to 7.7%, and subsequently, the average change in units sold, amounting to 50.2%. My interpretation of this data is that for each 7.7% reduction in price, there is a corresponding 50.2% increase in sales.
The outcome appears conservative, considering Tesla’s ambition to achieve sales of 20 million vehicles by 2030. However, the table below shows a reduced estimate of 14.3 million cars.
| Average Sales Price (In thousands of USD) | Units Sold (Thousands of cars) | Change in price % | Change in Units Sold % | |
| 2019 | 55 | 367.2 | -17.3% | 50.4% |
| 2020 | 48 | 499.0 | -12.7% | 35.9% |
| 2021 | 60.98 | 935.5 | 27.0% | 87.5% |
| 2022 | 58 | 1,313.86 | -4.9% | 40.4% |
| 2023 | 40.24 | 1,800.00 | -30.6% | 37.0% |
| 2024 | 38.09 | 2,421.00 | -5.3% | 34.5% |
| 2025 | 35.95 | 3,256.25 | -5.6% | 34.5% |
| 2026 | 33.81 | 4,379.65 | -6.0% | 34.5% |
| 2027 | 31.67 | 5,890.63 | -6.3% | 34.5% |
| 2028 | 29.52 | 7,922.90 | -6.8% | 34.5% |
| 2029 | 27.38 | 10,656.29 | -7.3% | 34.5% |
| 2030 | 25.24 | 14,332.72 | -7.8% | 34.5% |
Tesla’s Projected Deliveries vs Price Cuts (Author’s Calculations)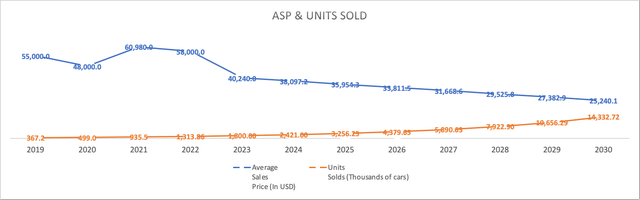
With these projections in mind, I proceed to calculate the revenues that Tesla may generate in the period from 2023 to 2028. The revenue column is derived from the table above, which outlines the price cuts and vehicle sales. I then include service and other revenues (insurance), applying a growth rate of 7.38%. For the solar segment, I use the previously mentioned growth rate of 6.9%.
| Revenue | Net Income | Plus Taxes | Plus D&A | Plus Interest | |
| 2023 | $84,787.0 | $10,454.24 | $11,365.85 | $15,103.49 | $15,232.43 |
| 2024 | $105,475.6 | $13,005.15 | $14,139.20 | $17,876.83 | $18,005.78 |
| 2025 | $131,641.3 | $16,231.38 | $17,646.76 | $23,449.85 | $23,650.06 |
| 2026 | $164,768.5 | $20,315.96 | $22,087.52 | $29,350.95 | $29,601.54 |
| 2027 | $206,746.6 | $25,491.86 | $27,714.77 | $36,828.70 | $37,143.12 |
| 2028 | $259,980.5 | $32,055.60 | $34,850.86 | $46,311.49 | $46,706.87 |
| ^Final EBITA^ |
| Sales of Vehicles | Service & Other | Solar | |
| 2023 | $72,432.0 | $7,243.0 | $5,112.0 |
| 2024 | $92,233.4 | $7,777.5 | $5,464.7 |
| 2025 | $117,448.0 | $8,351.5 | $5,841.8 |
| 2026 | $149,555.8 | $8,967.9 | $6,244.9 |
| 2027 | $190,441.2 | $9,629.7 | $6,675.8 |
| 2028 | $242,503.8 | $10,340.4 | $7,136.4 |
| D&A Projection | Interest Projection | |
| 2023 | 3,737.633 | 128.95 |
| 2024 | 3,737.633 | 128.95 |
| 2025 | 5,803.094 | 200.20 |
| 2026 | 7,263.428 | 250.58 |
| 2027 | 9,113.932 | 314.43 |
| 2028 | 11,460.621 | 395.38 |
DCF 3 (Author’s Calculations)
In my conservative model, the present fair price is estimated at $213.2, representing an 18.2% decrease from the current stock price of $260.5. Furthermore, the projected future stock price of $396.6 suggests a modest upside of 52.2%, equating to a 10.4% return over a five-year period.
Then what?
Undoubtedly, my choice leans towards aligning with the analysts’ expectations and my own, whereas Tesla’s master plan ventures into the realm of speculation. The significant contrast between the first and third scenarios, which are my own projections, revolves around Tesla’s current trailing twelve-month [TTM] revenue of $94 billion. In my “estimates” scenario, I suggest a decrease all the way to $72 billion by year-end. Admittedly, this $22 billion decline may seem somewhat unrealistic, but as you could have seen Tesla’s downside could be estimated at 18%, in case of market downturn.
Now, if we calculate the average fair value from the two models, $290.8 and $213.2, we arrive at $251.5, which closely aligns with the current stock price of $260.5. This implies that Tesla is currently trading at a fair valuation. Employing the same approach with future values yields a projected fair price of $473.5, representing an annual return of 16%. As demonstrated in the first scenario, with the 30% revenue growth rate, the annual return could potentially reach as high as 22%.
With these considerations in mind, I am of the opinion that Tesla represents a strong buy.
Risks to Thesis
Firstly, Tesla could be vulnerable to economic downturns or unforeseen crises. However, this could potentially present more of an opportunity than a risk, given Tesla’s robust financial position, substantial cash reserves, and minimal debt burden. This strength is further emphasized by its strong profit margins. As evident in the tables attempting to predict car sales through price cuts, even when Tesla raised its prices in 2021, deliveries surged by 87%.
The second risk lies in Tesla becoming overly ambitious with price reductions, potentially eroding its operating margins. This could strain the company’s finances, leading to the utilization of its cash reserves and an increase in debt. Tesla’s ability to grow rapidly is partly attributed to its low levels of debt.
Lastly, it’s essential to recognize that much of Tesla’s success is closely tied to CEO Elon Musk. If an unforeseen event, such as Musk’s sudden demise, were to occur, it could significantly impact Tesla’s stock price. Unless a figure akin to the “Tim Cook of Tesla” were to step in, the company could face uncertainty and a huge decline in stock value.
Conclusion
Few companies have captured the imagination and fervor of investors quite like Tesla. As we’ve delved into various valuation scenarios and examined the factors influencing Tesla’s potential, a fascinating picture emerges. Analysts’ expectations and my own projections provide valuable insight, showcasing a range of potential outcomes for Tesla’s future. The first scenario, aligned with analysts’ expectations, projects a 30% revenue growth rate, potentially signaling a bright future for the electric vehicle giant. The second, more speculative scenario explores the possibility of Tesla becoming a $3.2 trillion corporation, underlining the ambitious nature of Musk’s vision.
Yet, it’s not without its risks. Economic downturns and Tesla’s own ambition to reduce prices significantly could challenge the company’s financial resilience, emphasizing the importance of a balanced approach. Moreover, the undeniable link between Tesla’s success and the visionary leadership of Elon Musk underscores the fragility of the company’s stock value in the event of unforeseen circumstances. Still, it’s worth noting that even amid price hikes in 2021, Tesla’s deliveries surged, reflecting its strong market position and customer loyalty.
In conclusion, Tesla is a captivating investment opportunity, teetering between optimism and realism. The numbers suggest that it’s currently trading at a fair valuation, and that it could deliver up to 22% annual return for the next five years.
Read the full article here
