Escalations in the Israel/Iran conflict ensured the “new phase” in the S&P500 highlighted in last weekend’s article continued lower as expected. The break of 5048-56 suggests a large correction should eventually target an undercut of 4818.
While this is a useful medium-term expectation, it leaves a lot of unanswered questions in the near-term. Perhaps most pressing is whether the correction will continue directly lower, or if Friday’s futures low of 4924 was short-term capitulation and will lead to a bounce?
This weekend’s article will look at probable paths for the remainder of the correction and where exactly it may end up targeting. Various techniques will be applied to multiple timeframes in a top-down process which also considers the major market drivers. The aim is to provide an actionable guide with directional bias, important levels, and expectations for future price action.
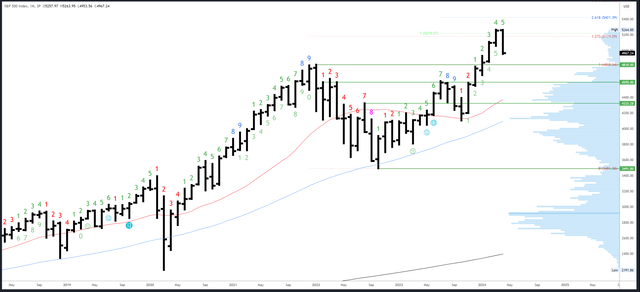
S&P 500 Monthly
The April bar has now broken the March low and is trading in the February range which extends down to 4853. It may look bearish, and it may take several months to repair, but the points made in last week’s article are still valid and provide a bigger picture bullish bias.
Firstly, the Q1 and March bars closed right at the highs and there has been no clear signs of rejection; rather, the April bar faded from inside the March range leaving a “weak” high.
Secondly, when January, February and March all close higher like they have this year, the rest of the year has closed higher 19 out of 20 times.

SPX Monthly (Tradingview)
The 5264.85 high is the only resistance.
January’s high of 4931 is a potential minor level of support, with 4853 and 4818 major levels below there.
April is bar 5 (of a possible 9) in an upside Demark exhaustion count.
S&P 500 Weekly
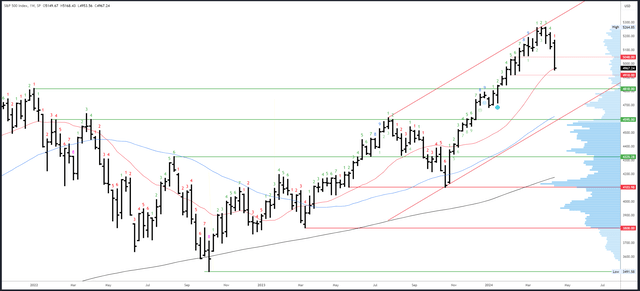
After a steady climb up the stairs in February and March, the S&P500 is now taking the elevator down. The drop has reached the 20-week MA but the close at the lows suggests there should be more downside to come at some point. This may not happen straight away if weekend news is positive. A close at the lows can lead to a bounce when Friday’s traders de-risk into the weekend fearing the worst, and buy back on Monday when the worst (hopefully) doesn’t transpire.
Thursday’s overnight collapse on the Israel attack reached a low of 4924 in futures, near 4918-20 weekly support. This may be a short-term capitulation, but is likely re-tested in the coming weeks.

SPX Weekly (Tradingview)
Resistance is at 5050 and 5108. There’s no point in drawing in retrace levels, yet, as we don’t know if the low is in. I would expect at least a 50% retrace, and perhaps up to a 70% retrace.
The 20-week MA is potential support, as is the 4918-20 area.
The upside Demark exhaustion signal looks to be having an effect with a similar delay to the July ’23 signal. A new downside count is underway and will be on bar 2 next week.
S&P 500 Daily
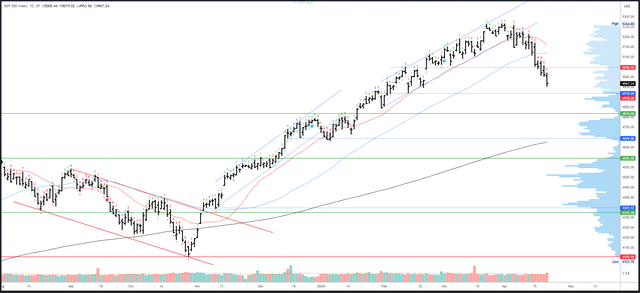
The S&P500 closed lower every day this week. A brief pause in the 5048-56 inflection area eventually broke convincingly and strongly suggests the correction will now break below 4818.
Due to the futures collapse on Thursday night/Friday morning, the futures and cash charts look quite different. The futures move looked like capitulation and tested weekly support before rallying 1.9%. Moreover, now the bad news is out – i.e. Israel has made its expected retaliation – the conditions for a recovery are improved. Friday’s weakness was partly due to lingering nervousness about weekend news flow, but also a heavy technology sector. Notably, the Dow Jones (DJI) actually closed 3 points higher last week.
A recovery therefore seems probable next week and the futures low of 4924 should hold as long as there is no escalation over the weekend.

SPX Daily (Tradingview)
5007 is a minor inflection point to the upside. Trading above would help the case for a recovery. The 5048-56 may again be “sticky” as the volume profile fills in the void in this area. 5108 is weekly resistance in confluence with the 50dma.
Support is at the futures low of 4924 and the 4918-20 pivots. The gap at 4845-53 is actually a monthly gap so is relevant for a bounce, but all roads seem to lead to 4818.
A downside Demark exhaustion signal will be on bar 8 on Monday and will therefore be active.
Drivers/Events
Bearish catalysts are back in focus. Obviously the Middle East conflict is a major concern, but scary headlines and sharp drops are generally buying opportunities. Mingled in with the chaotic headlines, other negatives are pulling the S&P500 lower. Fed Chair Powell finally caved last week and admitted a “lack of further progress” on inflation and rates may have to be held steady for longer. Furthermore, technology has been weak and the S&P500 will struggle to rally when Nvidia (NVDA) is crashing.
The “higher for longer” narrative and earnings season create a similar environment to Q3 last year when the last major correction unfolded. Indeed, the patterns of the drops are comparable, at least so far. It’s something to keep an eye on.
Monday has no top tier data scheduled for release and movement will likely hinge on weekend news. PMIs will be released on Tuesday, GDP on Thursday and the PCE Price Index on Friday. Powell has made it fairly clear that only inflation data matters to the delay of a cut. Economic weakness may bring that forward again, but next week’s data isn’t likely to feature in that decision.
Next week will be complicated by earnings. Netflix (NFLX) weighed on the technology sector on Friday. Meta (META), Alphabet (GOOGL), Tesla (TSLA) and Microsoft (MSFT) are all up next week. Growth estimates for the rest of ’24 have been climbing in recent weeks, but this is mostly due to energy company revisions.
Probable Moves Next Week(s)
Was Friday’s futures low of 4924 a capitulation bottom? Obviously that depends on weekend news, but it has good odds of being a short-term bottom. With a Demark daily exhaustion signal active on Monday, any sign of a reversal (new cash lows that are rejected / a strong close) could lead to a decent bounce. 5048-5050 is the initial target, but should eventually break for 5108.
Bigger picture, there are two main takeaways. Firstly, a sustainable bottom is only likely to be made below 4818. This could be as low as 4700 but the exact target is best worked out nearer the time. Secondly, the higher timeframes have a weak high at 5264.85 and a move to new highs is still probable this year. This overview provides a clear longer-term trade plan – buy below 4818 for above 5264. It sounds easy, but never is.
Read the full article here


