
This article series aims at evaluating ETFs (exchange-traded funds) regarding the relative past performance of their strategies and metrics of their current portfolios. Reviews with updated data are posted when necessary.
SLYV strategy
SPDR® S&P 600 Small Cap Value ETF (NYSEARCA:SLYV) started investing operations on 9/25/2000 and tracks the S&P SmallCap 600 Value Index. It has a portfolio of 461 stocks, an expense ratio of 0.15% and a 30-day SEC yield of 2.44%. It is a direct competitor to Vanguard S&P SmallCap 600 Value ETF (VIOV) and iShares S&P Small-Cap 600 Value ETF (IJS), which track the same underlying index and have similar expense ratios.
As described by S&P Dow Jones Indices, S&P 600 constituents are categorized based on their value and growth potential, evaluated using three valuation ratios and three growth metrics. The valuation ratios are book value to price, earnings to price and sales to price. By definition, 33% of S&P 600 constituents exclusively belong to value style, 33% exclusively belongs to growth style and 34% belongs to both styles.
The Value style subset defines the S&P 600 Value Index. It is rebalanced annually and is capital-weighted, with an adjustment for constituents belonging to both styles. For instance, a company with a higher value rank than its growth rank is given a higher weight in the Value Index than in the Growth Index. The portfolio turnover rate was 46% in the most recent fiscal year. This article will use as a benchmark the parent index S&P 600, represented by iShares Core S&P Small-Cap ETF (IJR).
The SLYV portfolio
The heaviest sector in the portfolio is financials with 25.4% of asset value, followed by industrials (15.8%) and consumer discretionary (12.6%). Compared to the S&P 600, SLYV overweights mostly financials, and to a lesser extent real estate. It significantly underweights energy.
SLYV Sector breakdown (chart: author; data: SSGA, iShares)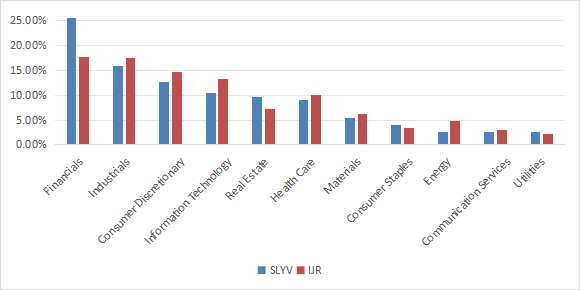
The top 10 holdings, listed below with valuation ratios, represent 8.5% of asset value, and the heaviest position weighs about 1%. Therefore, the portfolio is well-diversified across holdings and risks related to individual companies are very low.
|
Ticker |
Name |
Weight (%) |
P/E TTM |
P/E fwd |
P/Sales TTM |
P/Book |
P/Net Free CashFlow |
Yield% |
|
LNC |
Lincoln National Corp. |
0.98 |
4.42 |
5.45 |
0.33 |
0.85 |
N/A |
5.56 |
|
JXN |
Jackson Financial, Inc. |
0.95 |
1.98 |
4.36 |
1.66 |
0.62 |
1.18 |
3.71 |
|
DY |
Dycom Industries, Inc. |
0.94 |
23.26 |
22.25 |
1.25 |
4.94 |
59.82 |
0 |
|
OGN |
Organon & Co. |
0.94 |
5.04 |
4.64 |
0.84 |
110.72 |
24.27 |
5.44 |
|
COOP |
Mr. Cooper Group, Inc. |
0.93 |
8.49 |
8.55 |
2.68 |
1.22 |
N/A |
0 |
|
ALK |
Alaska Air Group, Inc. |
0.91 |
21.69 |
8.61 |
0.49 |
1.29 |
N/A |
0 |
|
ASO |
Academy Sports & Outdoors, Inc. |
0.75 |
8.43 |
8.33 |
0.70 |
2.20 |
14.35 |
0.78 |
|
VFC |
VF Corp. |
0.71 |
N/A |
15.89 |
0.45 |
2.82 |
9.36 |
2.99 |
|
AL |
Air Lease Corp. |
0.68 |
9.39 |
10.80 |
2.04 |
0.72 |
N/A |
1.80 |
|
SANM |
Sanmina Corp. |
0.66 |
15.79 |
12.44 |
0.48 |
1.75 |
21.35 |
0 |
Fundamentals
SLYV is cheaper than its parent index regarding valuation ratios and has lower growth rates, in accordance with the strategy description. Nevertheless, the gap in price/earnings is marginal, as reported in the next table.
|
SLYV |
IJR |
||
|
P/E TTM |
14.21 |
14.88 |
|
|
Price/Book |
1.21 |
1.63 |
|
|
Price/Sales |
0.69 |
0.96 |
|
|
Price/Cash Flow |
6.51 |
8.25 |
|
|
Earnings growth |
9.32% |
17.93% |
|
|
Sales growth |
3.98% |
5.62% |
|
|
Cash flow growth % |
2.04% |
8.82% |
|
Source: Fidelity.
In my ETF reviews, risky stocks are companies with at least 2 red flags among bad Piotroski score, negative ROA, unsustainable payout ratio, bad or dubious Altman Z-score, excluding financials and real estate where these metrics are unreliable. With this assumption, risky stocks weight about 27% of asset value: this is a bad point. Moreover, based on my calculation of aggregate quality metrics (reported in the next table), portfolio quality is inferior to the benchmark.
|
SLYV |
IJR |
|
|
Altman Z-score |
1.94 |
2.81 |
|
Piotroski F-score |
5.16 |
5.39 |
|
ROA % TTM |
1.65 |
3.56 |
Performance
Since October 2000, the difference between SLYV and IJR in return and risk metrics is hardly significant: 32 bps in annualized return, 3.3 percentage points in maximum drawdown and 71 bps in historical volatility (measured as standard deviation of monthly returns). Their risk-adjusted performances are almost identical (Sharpe ratio).
|
Total Return |
Annual Return |
Drawdown |
Sharpe ratio |
Volatility |
|
|
SLYV |
633.59% |
8.79% |
-61.49% |
0.45 |
20.32% |
|
IJR |
686.13% |
9.11% |
-58.15% |
0.46 |
19.61% |
However, SLYV has lagged the benchmark by almost 4% in 2024 to date:
SLYV vs. IJR, year-to-date (Seeking Alpha)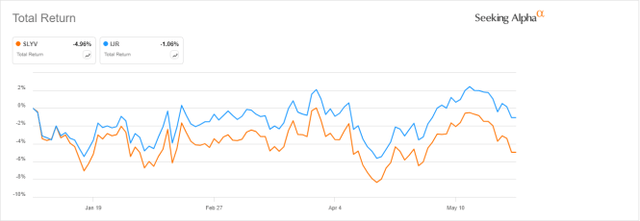
Competitors
The next table compares characteristics of SLYV and four other small cap value funds:
- iShares Russell 2000 Value ETF (IWN), reviewed here
- Vanguard Small Cap Value ETF (VBR)
- Dimensional US Small Cap Value ETF (DFSV), reviewed here
- Avantis U.S. Small Cap Value ETF (AVUV).
|
SLYV |
IWN |
VBR |
DFSV |
AVUV |
|
|
Inception |
9/25/2000 |
7/24/2000 |
1/26/2004 |
2/23/2022 |
9/24/2019 |
|
Expense Ratio |
0.15% |
0.24% |
0.07% |
0.31% |
0.25% |
|
AUM |
$3.82B |
$11.70B |
$52.02B |
$3.01B |
$11.33B |
|
Avg Daily Volume |
$13.81M |
$187.62M |
$82.81M |
$12.16M |
$58.63M |
|
Holdings |
461 |
1415 |
863 |
974 |
772 |
|
Top 10 |
8.49% |
4.97% |
5.72% |
6.72% |
8.89% |
|
Turnover |
46.00% |
32.00% |
16.00% |
11.00% |
7.00% |
|
Div. Yield TTM |
2.29% |
1.99% |
2.10% |
1.28% |
1.63% |
SLYV has the highest yield and turnover. VBR is the largest in assets and has the cheapest fee, whereas IWN is the most liquid in dollar volume. The next chart compares total returns, starting on 2/24/2022 to match all inception dates. SLYV and IWN are the worst performers in this time frame. The two actively managed funds lead the pack.
SLYV vs competitors since 2/24/2022 (Seeking Alpha)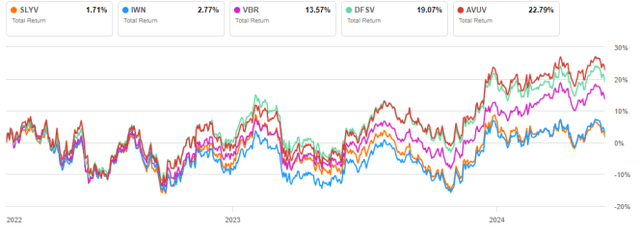
Additionally, SLYV is lagging its 4 competitors in 2024 to date:
SLYV vs competitors, year-to-date (Seeking Alpha)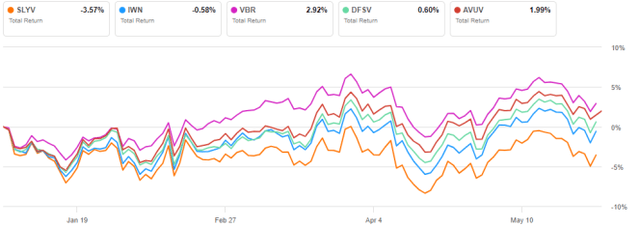
Comparing SLYV with my value benchmark
The Dashboard List is a list of 80 stocks in the S&P 1500 index, updated every month based on a simple quantitative methodology. All stocks in the Dashboard List are cheaper than their respective industry median in Price/Earnings, Price/Sales and Price/Free Cash Flow. After this filter, the 10 companies with the highest Return on Equity in every sector are kept in the list. Some sectors are grouped together: energy with materials, communication with technology. Real estate is excluded because these valuation metrics don’t work well in this sector. I have been updating the Dashboard List every month on Seeking Alpha since December 2015, first in free-access articles, then in Quantitative Risk & Value.
The next table compares SLYV performance since inception with the Dashboard List model, with a tweak: here the list is reconstituted once a year to make it comparable with a passive index.
|
Total Return |
Annual Return |
Drawdown |
Sharpe ratio |
Volatility |
|
|
SLYV |
633.59% |
8.79% |
-61.49% |
0.45 |
20.32% |
|
Dashboard List (annual) |
1263.11% |
11.68% |
-56.38% |
0.63 |
17.48% |
Past performance is not a guarantee of future returns. Data Source: Portfolio123.
The Dashboard List beats SLYV by 2.9 percentage points in annualized return and shows a lower risk measured in drawdown and volatility. A note of caution, though: ETF performance is real, and the list is simulated.
Two weaknesses of value indexes
I’m in favor of mixing various ratios to rank value stocks. However, I think most value indexes doing so have two weaknesses, and the S&P 600 Value Index is no exception. The first one is to classify all stocks with the same criteria. It means valuation ratios are considered comparable across sectors and industries. Obviously, they are not: my monthly S&P 500 dashboard shows how valuation and quality metrics may vary across sectors.
The second weakness comes from the price/book ratio (P/B), which adds some risk to the strategy. Historical data show that a large group of companies with low P/B has a higher volatility and deeper drawdown than a same-size group with low price/earnings, price/sales or price/free cash flow. The next table shows the return and risk metrics of the cheapest quarter of the S&P 500 (i.e., 125 stocks) measured in price/book, price/earnings, price/sales and price/free cash flow. The sets are reconstituted annually between 1/1/2000 and 1/1/2024 with elements in equal weight.
|
Annual Return |
Drawdown |
Sharpe ratio |
Volatility |
|
|
Cheapest quarter in P/B |
9.86% |
-73.88% |
0.47 |
23.25% |
|
Cheapest quarter in P/E |
10.63% |
-63.06% |
0.55 |
19.88% |
|
Cheapest quarter in P/S |
11.60% |
-68.78% |
0.54 |
22.70% |
|
Cheapest quarter in P/FCF |
12.65% |
-64.24% |
0.62 |
20.63% |
|
Equal Weight Index (RSP) |
9.16% |
-59.92% |
0.5 |
17.55% |
Data calculated with Portfolio123.
This explains why I use P/FCF and not P/B in the Dashboard List model.
Actively managed ETFs AVUV and DFSV have a smarter approach than the usual value indexes, which explains why they have outperformed passively managed ETFs.
Takeaway
SPDR S&P 600 Small Cap Value ETF combines two of the three factors of the original Fama-French model: value and size. It is well-diversified across holdings, but overweight in financials. SLYV, IJS and VIOV have the same underlying index, and they are equivalents for long-term investors. However, liquidity makes IJS more suitable for short-term trading.
SLYV performance and risk metrics since 2000 are very close to the S&P SmallCap 600, and portfolio quality is inferior. The strategy has failed to bring excess return over its parent index in the long term. Like most value indexes, it has two weaknesses: ranking stocks regardless of their industries, and relying too much on the price/book ratio.
Read the full article here
