
Readers often ask why I am so negative on closed-end funds. The problem I find is that many closed-end funds lure unsuspecting investors with high distribution yields that are not supported by the fund’s returns. Investors end up losing out in the long-run after many years of NAV declines and shrinking distributions.
While other analysts may turn a blind eye and write bullish articles touting these ‘8% yields to fund my retirement’, my conscience demands I shine a light on funds that do not earn their distribution yields when I come across them.
The Putnam Premier Income Trust (NYSE:PPT) is a classic example of one of these amortizing ‘return of principal’ funds. It promises a monthly distribution that yields 8.8%. However, it has a 10Yr average annual return of only 2.1%. The distribution is clearly unsustainable.
I recommend investors avoid the PPT fund and other similar ‘return of principal’ funds.
Fund Overview
The Putnam Premier Income Trust is a closed-end fund (“CEF”) that aims to deliver high current income from a diversified portfolio of fixed income securities. The PPT fund allocates between U.S. government bonds, high yield corporate securities, international bonds, and asset backed securities.
The PPT fund dynamically allocates risk exposures rather than having set sector exposures and actively manages its duration risk.
The PPT fund has $370 million in assets and charged a 0.96% expense ratio in fiscal 2022.
Portfolio Holdings
Figure 1 shows the PPT fund’s sector allocation as of June 30, 2023. The PPT fund has 45.8% allocated to Agency pass-through securities, 14.8% in high-yield corporate bonds, 14.6% in CMBS, 13.5% in agency CMO securities and 12.5% in emerging market bonds.
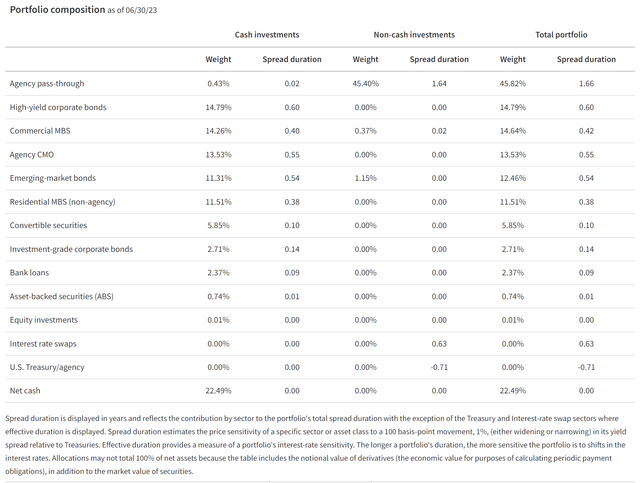
Figure 1 – PPT sector allocation (putnam.com)
Three facts stand out about PPT’s portfolio. First, investors should note that the sector weights sum to more than 100%. This is indicative of the fund using leverage to ‘enhance’ returns. Second, the fund quote spread duration, which implies the fund actively hedges away interest rate risk (i.e. buying a corporate bond and hedging out duration to capture the credit spread), as per the fund description above. Finally, the PPT fund had an astonishing 1,665% turnover rate in fiscal 2022 (Figure 2).
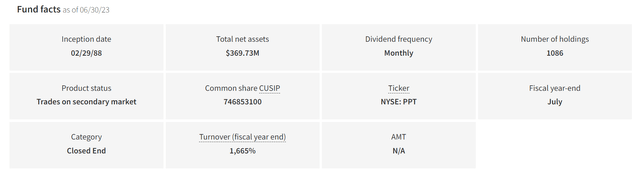
Figure 2 – PPT fund facts (putnam.com)
At first, I thought it must be a misprint. However, the figure is repeated in the annual reports. Effectively, PPT’s portfolio turns over every 3 weeks! This is one of the highest turnover rates I have seen and is atypical of fixed income funds that I have analyzed.
Figure 3 shows the PPT fund’s maturity allocation and credit quality allocation. The fund primarily invests in medium term securities between 5-10 years. About 1/4 of the portfolio is rated investment grade (>BBB), with 35% rated non-investment grade and 15% unrated. The fund also has an unusually high cash allocation at 22.5% of the portfolio.
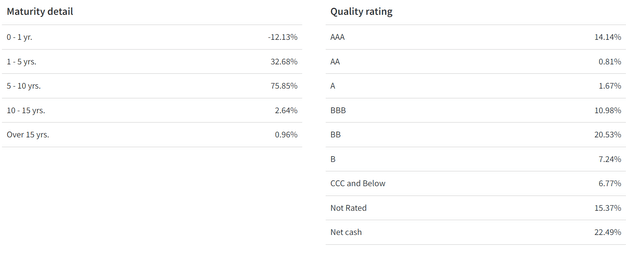
Figure 3 – PPT maturity and credit quality allocation (putnam.com)
Returns
Figure 4 details the PPT fund’s historical returns. Unlike other fixed income funds with high portfolio duration, the PPT fund navigated 2022 well, losing only 1.6%. However, PPT’s long-term track record leaves much to be desired as it has 3/5/10/15Yr average annual returns of -0.1%/-0.1%/2.1%/3.9% respectively to June 30, 2023. Effectively, the fund had been dead money for 5 years.
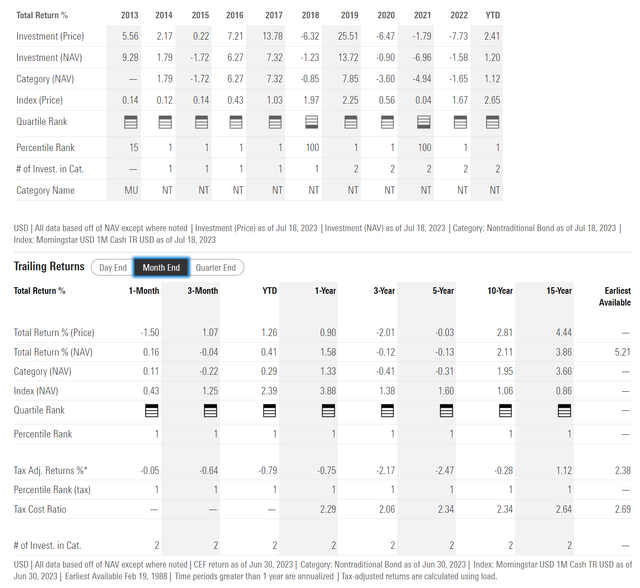
Figure 4 – PPT historical returns (morningstar.com)
PPT’s performance is incredibly bad when we consider that treasury bills, as measured by the ICE BofA U.S. Treasury Bill Index returned 1.6% over 5 years (Figure 5). So PPT is underperforming cash.
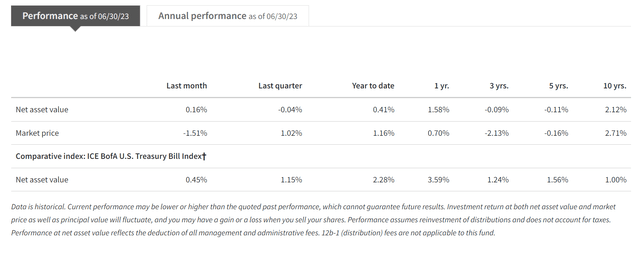
Figure 5 – PPT underperforms cash (putnam.com)
Distribution & Yield
However, despite poor investment returns, the PPT fund maintains a monthly distribution of $0.026 which annualizes to a forward yield of 8.8%. On NAV, the PPT fund is yielding 8.1%.
However, given the fund’s poor investment returns, I fear the distribution yield is not sustainable. Historically, the PPT fund has utilized return of capital (“ROC”) to fund part of its distribution (Figure 6).
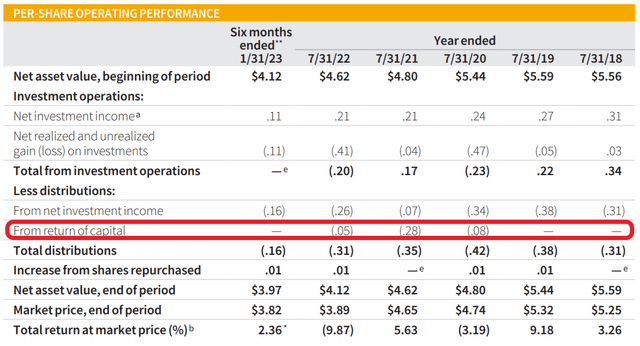
Figure 6 – PPT financial summary (PPT semi-annual report)
More importantly, the PPT fund shows all the hallmarks of being an amortizing ‘return of principal’ fund that cannot earn its yield.
Investors in ‘return of principal’ funds end up losing on both principal, as market price tracks a shrinking NAV, and income, as inevitably, unsustainable distributions are cut.
Figure 7 shows PPT’s historical NAV and market price while figure 8 shows PPT’s shrinking annual distributions.
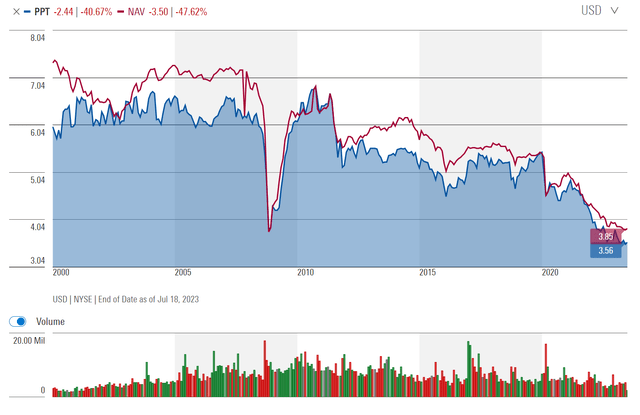
Figure 7 – PPT historical NAV (morningstar.com)
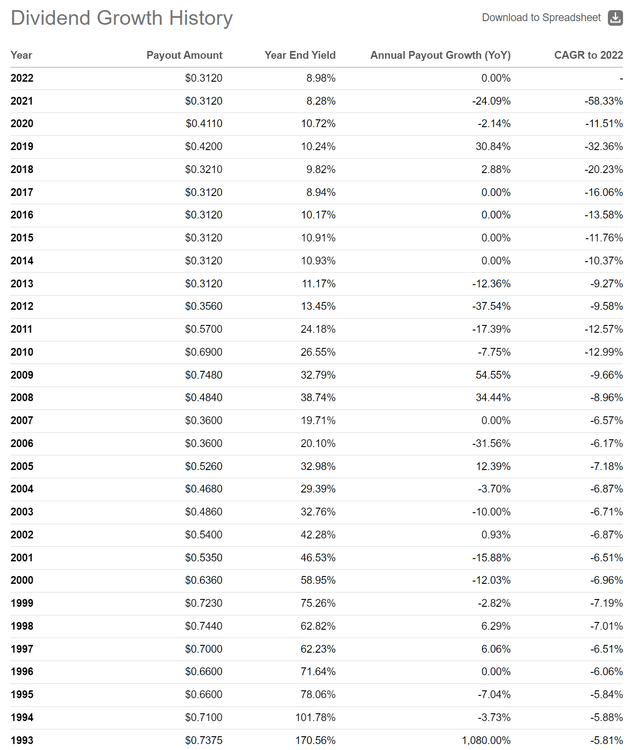
Figure 8 – PPT historical distribution (Seeking Alpha)
Conclusion
In my opinion, there is nothing ‘premier’ about the Putnam Premier Income Trust. It appears to be a classic example of an amortizing ‘return of principal’ fund where investors are lured with an attractive distribution yield that is not supported by the fund’s earnings. The PPT fund pays 8.8% but earns only 2.1% over 10 years. Long-term investors end up losing both principal and income when they invest in ‘return of principal funds’. I would avoid the PPT fund.
Read the full article here
