
Market Recap
Despite rising interest rates and stubborn inflation, equities are proving to be resilient in 2023. June capped off a strong finish to the first half of the year, the SPDR S&P Trust ETF (SPY) added 6.48% during the month and is up 16.80% year-to-date. Dividend stocks and more specifically higher yielding dividend stocks are not fairing as strong, but they too enjoyed a strong push in June to cap off a decent run for the first half of the year.
Vanguard High Dividend Yield ETF (VYM) posted a return of 5.52% in June but is still down 0.46% year-to-date. My top 10 list finished last month with a gain of 5.63% and is up 7.45% year-to-date. While my list lagged the S&P it is fairing quite well compared to VYM.
Since I started tracking this list in November of 2020 it has generated an annualized rate of return of 13.19%. The SPDR S&P 500 Trust ETF is fairing a little better with an annualized rate of return of 13.91%. VYM is outpacing both the S&P and my list with an annualized rate of return of 15%. The reason for VYM’s strong performance was its resilient return in 2022 of -0.45%, while my watchlist lost 11.95% and SPY fell by 18.16%. My watchlist has a bigger focus on growth and therefore tends to underperform when market sentiment is poor but it outperforms when market sentiment is favorable. Since over the long term positive market periods last longer than negative market periods, I am optimistic my watchlist will catch-up and surpass VYM in due time.
The main purpose of a high dividend yield portfolio is not to outperform the broad market but to generate a passive income stream that is relatively safe, reliable, and one that can grow in the future. The top 10 stocks on my watchlist for July 2023, collectively, offer a 4.82% dividend yield that is more than double the dividend yield of the S&P 500. These 10 stocks have also grown their dividends at a historical rate of 33.34% per year during the last five years. Collectively, all 10 stocks appear to be potentially about 30% undervalued right now based on dividend yield theory.
The best way to create a strong high yield dividend portfolio is with a buy-and-hold strategy. This strategy forces you to think about the stocks you decide to invest your capital into as the plan is to hold the positions indefinitely. Applying this approach over the long term while focusing on potentially undervalued stocks allows investors to generate alpha through capital appreciation. While this may not pan out for every position, diversifying your high-yield portfolio across 20 or more unique stocks will increase the odds of picking up shares of certain stocks when they are trading for bargain prices. The beauty of a long-term outlook is time; you can sit back and wait for the valuation to revert to historical norms, all the while collecting a generous passive income stream.
Watchlist Criteria
Creating the high yield watchlist, I had four areas of interest that I focused on: basic criteria, safety, quality, and stability. First off, the basic criterion aims to narrow down the list of stocks to those that pay a dividend, offer a yield above 2.75%, and trade on the NYSE and NASDAQ. The next set of criteria focuses on safety because that is a crucial part of a high yield investing strategy. The filter excludes companies with payout ratios above 100% and companies with negative 5-year dividend growth rates. Another level of safety can be associated with larger companies; therefore, the watchlist narrows in on stocks with a market cap of at least $10 billion. The next set of criteria set out to narrow down the list to include higher quality businesses.
The three filters for quality are: a wide or narrow Morningstar moat, a standard or exemplary Morningstar stewardship, and an S&P quality rating of B+ or higher. A Morningstar moat rating represents the company’s sustainable competitive advantage, the main difference between a wide and narrow moat is the duration that Morningstar expects that advantage to last. Companies with a wide moat are expected to maintain their advantage for the next 20 years, whereas companies with a narrow moat are expected to maintain their advantage for the next 10 years. The Morningstar stewardship evaluates the management team of a company with respect to shareholders’ capital.
The S&P quality rating evaluates a company’s earnings and dividend history. A rating of B+ or higher is associated with above-average businesses. The last set of criteria focuses on the stability of a company’s top-line and bottom-line growth. The filter eliminates companies with negative 5-year revenue or earnings per share growth rate. I believe a company that is growing both their top-line and bottom-line has the ability to provide growth to its investors in the future.
All of the stocks that pass the initial screener criteria (44 this month) are then ranked based on quality and valuation. Further, I sort the stocks in descending order based on the best combination of quality and value and select the top 10 stocks that are forecasted to have at least a 12% annual long-term return.
July 2023 Watchlist
Here is the watchlist for July 2023. There are two changes from the prior month: Goldman Sachs (GS) and PNC Financial Services Group (PNC) drop off and are replaced by BlackRock (BLK) and Unilever PLC (UL). The data shown in the image below is as of 6/30/23.
Created by Author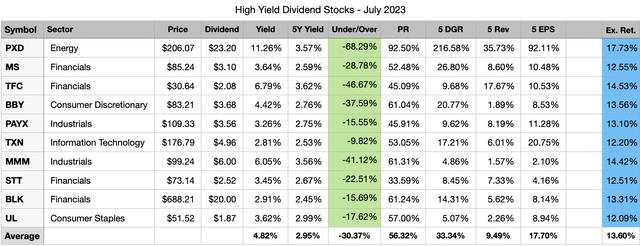
All of the selected stocks this month appear to be potentially undervalued based on dividend yield theory.
The expected rate of return shown in the last column is computed by taking the current dividend yield plus a return to fair value over the next 5 years and a discounted long-term earnings forecast.
Please keep in mind that my return forecasts are based on assumptions and should be viewed as such. I am not expecting that these 10 companies will hit the forecasted returns. What I do expect is that these 10 companies have the potential to offer better returns during the next 5 years compared to the 34 high yield stocks that passed my initial filters but ranked worse in quality and valuation.
Past Performance
The top 10 list for June performed well, collectively the 10 chosen stocks were up by 5.63%. This was 0.11% better than VYM and 0.85% worse than SPY. The watchlist is off to a decent start this year in comparison to VYM but its lack of exposure to technology stocks is causing it to lag SPY. Since inception, which was 32 months ago, the watchlist trails VYM by 1.82% and SPY by 0.72%. The gap to VYM is shrinking, while SPY’s strong run this year has pushed it ahead of my watchlist.
I do not expect that this watchlist will beat VYM or SPY every month. However, I believe that a buy-and-hold investing approach leveraging the stocks presented on this watchlist will generate long-term alpha compared to the broad market. I also have a personal target rate of return of 12% that I believe will be attained by this watchlist when measured over long periods of time.
Following June, the long-term annualized rate of return for the watchlist increased from 11.26% to 13.19%. The 2.5 years of history I have measured thus far is a long period of time but I would really like to have 5 or 10 years of results before I start passing more judgment.
|
Date |
Watchlist |
ALL |
VYM |
SPY |
|
6 month |
7.45% |
1.77% |
-0.46% |
16.80% |
|
3 month |
1.08% |
0.59% |
1.38% |
8.68% |
|
1 month |
5.63% |
5.72% |
5.52% |
6.48% |
|
YTD |
7.45% |
1.77% |
-0.46% |
16.80% |
|
Since Inception |
39.14% |
45.12% |
45.18% |
41.52% |
|
Annualized |
13.19% |
14.99% |
15.00% |
13.91% |
The strong return in June was a welcome sight and a good way to cap off the first half of the year.
Individual watchlist returns for June 2023 were:
- (BBY) +14.12%
- (PNC) +8.74%
- (STT) +8.51%
- (MMM) +7.27%
- (PAYX) +6.61%
- (MS) +4.45%
- (PXD) +3.88%
- (TXN) +3.53%
- (TFC) -0.39%
- (GS) -0.42%
Top 5 performing past and present watchlist stocks in June 2023:
- (CMI) +19.94%
- (CMA) +19.35%
- (PFG) +15.86%
- (SNA) +15.80%
- (FDX) +14.37%
Top 5 Stocks by total return since joining the watchlist:
- (AVGO) +103.07% (26 months)
- (PFG) +114.02% (32 months)
- (MRK) +74.40% (26 months)
- (GD) +73.79% (32 months)
- (FDX) +70.00% (9 months)
Top 5 Stocks by Average Monthly return since joining the watchlist:
- (FDX) +6.07% (9 months)
- (FAST) +3.42% (5 months)
- (SWKS) +3.15% (9 months)
- (AVGO) +2.76% (26 months)
- (PFG) +2.41% (32 months)
In total there have been 77 unique high yield dividend stocks that have appeared in the top 10 list during the past 32 months. Out of these 77 unique stocks 55 have a positive total return since first appearing on the top 10 list. The average total return for these 55 stocks is 32.38%. The average loss for the 22 stocks that have negative total returns is -16.22%. Here are all 77 stocks, their total return since inception and the number of months since they first appeared in the top 10 list.
|
Symbol |
Since Inception |
Count |
|
PFG |
114.02% |
32 |
|
AVGO |
103.07% |
26 |
|
MRK |
74.40% |
26 |
|
GD |
73.79% |
32 |
|
FDX |
70.00% |
9 |
|
BMO |
67.79% |
32 |
|
JPM |
59.31% |
32 |
|
CSCO |
55.41% |
32 |
|
PGR |
55.34% |
29 |
|
TD |
55.12% |
32 |
|
PEP |
49.85% |
32 |
|
RY |
48.38% |
32 |
|
SNA |
43.88% |
17 |
|
LMT |
41.85% |
32 |
|
BK |
38.44% |
32 |
|
SO |
36.39% |
32 |
|
PAYX |
35.72% |
29 |
|
BNS |
35.27% |
32 |
|
STT |
35.04% |
32 |
|
SRE |
34.77% |
28 |
|
GIS |
34.45% |
23 |
|
ATO |
33.67% |
19 |
|
EPD |
33.04% |
23 |
|
PM |
32.51% |
28 |
|
SWKS |
32.19% |
9 |
|
CVS |
31.20% |
32 |
|
MTB |
30.07% |
32 |
|
CM |
29.90% |
32 |
|
QSR |
29.66% |
22 |
|
K |
27.64% |
28 |
|
CMI |
24.24% |
16 |
|
RCI |
22.05% |
32 |
|
DRI |
21.48% |
23 |
|
TRP |
20.84% |
32 |
|
TXN |
20.58% |
12 |
|
FAST |
18.28% |
5 |
|
CMCSA |
17.58% |
10 |
|
HBAN |
17.16% |
32 |
|
EVRG |
17.12% |
32 |
|
HD |
16.34% |
12 |
|
CMS |
15.96% |
28 |
|
CPB |
15.37% |
21 |
|
BLK |
14.70% |
14 |
|
MDT |
14.33% |
7 |
|
DTE |
14.24% |
32 |
|
KMB |
14.14% |
29 |
|
XEL |
13.97% |
28 |
|
AMGN |
11.56% |
32 |
|
PXD |
7.90% |
4 |
|
UL |
5.34% |
4 |
|
GLW |
4.14% |
4 |
|
WEC |
3.57% |
30 |
|
EOG |
2.93% |
4 |
|
NTRS |
2.64% |
32 |
|
LNT |
2.36% |
32 |
|
CLX |
-0.16% |
22 |
|
GS |
-0.42% |
1 |
|
XOM |
-1.35% |
3 |
|
OKE |
-1.45% |
3 |
|
VZ |
-1.47% |
7 |
|
USB |
-5.47% |
32 |
|
MS |
-5.79% |
23 |
|
AMT |
-6.89% |
9 |
|
DLR |
-10.02% |
16 |
|
UPS |
-11.06% |
16 |
|
BBY |
-13.64% |
18 |
|
BEN |
-14.53% |
18 |
|
HAS |
-15.29% |
32 |
|
INTC |
-17.09% |
32 |
|
TFC |
-18.98% |
32 |
|
PNC |
-19.29% |
4 |
|
TROW |
-22.73% |
17 |
|
BX |
-22.75% |
15 |
|
MMM |
-30.15% |
32 |
|
CMA |
-35.04% |
27 |
|
PARA |
-39.45% |
32 |
|
AAP |
-63.94% |
16 |
Closer Look
Here’s a closer look at the two new stocks on this month’s watchlist: BlackRock and Unilever.
Let’s start with the 7-year dividend yield theory chart for BlackRock.
Created by Author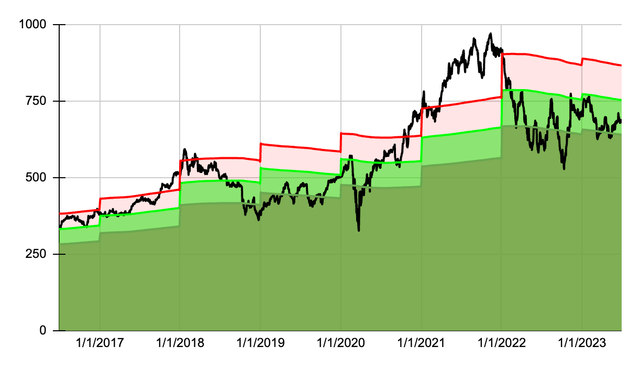
The share price peaked in mid to late 2021 and came crashing down in early 2022. During the past year the price has improved a little but dividend yield theory still suggests the stock is undervalued. As shown below the stock is offering above average yields today compared to 7 year averages.
Created by Author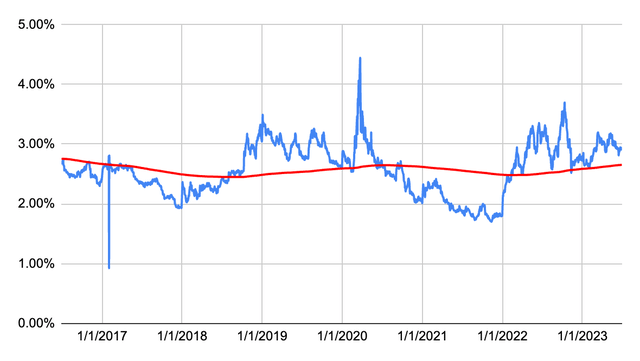
In the dividend growth department, BlackRock raised its dividend earlier this year but the increase was below par compared to the prior 10 years. At the new quarterly dividend rate of $5.00 per share investors will only see a 2.46% dividend increase compared to 2022. This is not the type of dividend growth you like to see from a company that doesn’t sport a high dividend yield. But given that BlackRock has a strong history of better dividend increases I expect to see larger increases in the future.
| Year | Dividend | Growth | CAGR |
| 2023 | 20.00 | 2.46% | |
| 2022 | 19.52 | 18.16% | 2.46% |
| 2021 | 16.52 | 13.77% | 10.03% |
| 2020 | 14.52 | 10.00% | 11.26% |
| 2019 | 13.20 | 9.82% | 10.95% |
| 2018 | 12.02 | 20.20% | 10.72% |
| 2017 | 10.00 | 9.17% | 12.25% |
| 2016 | 9.16 | 5.05% | 11.80% |
| 2015 | 8.72 | 12.95% | 10.93% |
| 2014 | 7.72 | 14.88% | 11.16% |
| 2013 | 6.72 | 12.00% | 11.52% |
| 2012 | 6.00 | 9.09% | 11.57% |
| 2011 | 5.50 | 11.36% |
Now let’s take a look at Unilever, here is the 7-year dividend yield theory chart.
Created by Author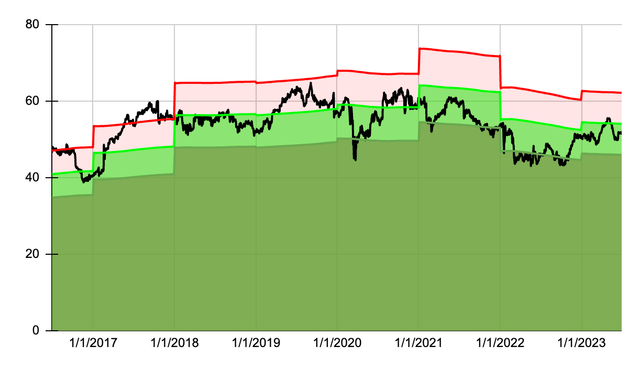
Unilever is trading at a discount to fair value as suggested by dividend yield theory. The price has remained flat since about mid 2017 with some bumps here and there. In all honesty it doesn’t look like long term shareholders should be satisfied with the total return from this company. Unilever does offer a pretty good dividend yield of about 3.6% which is slightly better than average compared to its yield from the past 7 years. Personally I would like to see more capital appreciation on top of the passive dividend income.
Created by Author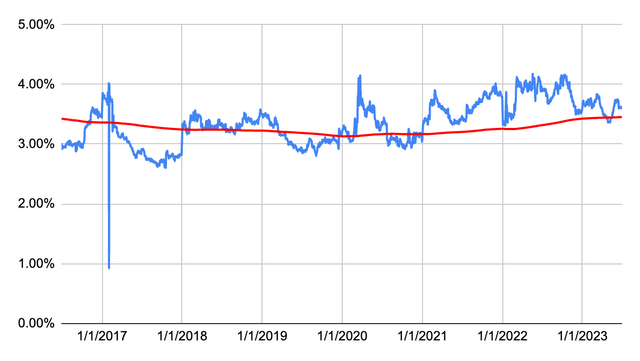
Unilever’s dividend growth history is a little mixed with some bumps in the road. Of course my figures below are in USD which can muddle the actual growth due to currency fluctuations. However, given that I am a US investor I am more interested in the USD dividend rate.
| Year | Dividend | Growth | CAGR |
| 2023 | 1.87 | 3.85% | |
| 2022 | 1.80 | -11.44% | 3.85% |
| 2021 | 2.03 | 9.75% | -4.10% |
| 2020 | 1.85 | 1.86% | 0.31% |
| 2019 | 1.82 | -0.52% | 0.70% |
| 2018 | 1.83 | 16.87% | 0.45% |
| 2017 | 1.56 | 11.43% | 3.02% |
| 2016 | 1.40 | 6.14% | 4.18% |
| 2015 | 1.32 | -12.35% | 4.42% |
| 2014 | 1.51 | 8.00% | 2.41% |
| 2013 | 1.40 | 13.81% | 2.96% |
| 2012 | 1.23 | -1.15% | 3.90% |
| 2011 | 1.24 | 3.47% |
Read the full article here
