In our previous analysis of Micron Technology, Inc. (NASDAQ:MU), we found that the company’s increased inventory resulted from a drop in demand growth compared to supply growth, affecting DRAM and NAND prices in 2023. Despite this, we expected pricing to stabilize as major memory manufacturers reduced spending, leading to a recovery in profitability after FY2023.
In this analysis, we focused on the company in light of the recent restrictions placed on Micron’s products in China. We assessed the potential implications on Micron’s revenue, taking into account its exposure to China and the extent of the imposed restrictions. Additionally, we scrutinized its competitors in the memory market to evaluate their capacity to meet the demand arising from these restrictions. Lastly, we delved into memory market pricing trends to determine if the ban could contribute to pricing growth.
Revenue Impact from New Restrictions
In May, Micron stated in a filing that the Cybersecurity Administration of China (‘CAC’) that its products “present a cybersecurity risk” and the regulatory body had “notified critical information infrastructure operators in China to stop using Micron products”. According to the BBC, the specific risks mentioned were not disclosed in the official translated CAC press release. Moreover, The Guardian highlighted the broad definition of “critical information infrastructure”:
The decision could affect Micron products in sectors ranging from telecoms to transport and finance, according to China’s broad definition of critical information infrastructure. – The Guardian
According to Practical Law, the CAC is tasked with “cyberspace security and internet content regulation” under the supervision of the Chinese government’s Central Cyberspace Affairs Commission. While it does not have jurisdiction over Hong Kong, the CAC and Hong Kong’s tech bureau had recently agreed to cooperate to create rules facilitating data flow between mainland China and Hong Kong.
Based on its latest earnings briefing, the company stated that its customers such as mobile OEMs had been notified by critical information infrastructure operators and the government regarding the CAC decision as explained in the quote below.
The impact of the May 21 decision by the Cyberspace Administration of China on Micron’s business remains uncertain and fluid. Several Micron customers, including mobile OEMs, have been contacted by certain critical information infrastructure operators or representatives of the government in China concerning the future use of Micron products. – Sanjay Mehrotra, President and Chief Executive Officer
Despite that, management did emphasize the uncertainty regarding the situation and reiterated it could still continue to evolve and was working to mitigate the risks. Nonetheless, management anticipates that roughly half of the revenue from customers headquartered in China could face potential impacts.
Geographic Revenue
Company Data, Khaveen Investments
|
Micron Geographical Revenue Breakdown ($ mln) |
2018 |
2019 |
2020 |
2021 |
2022 |
Average |
|
United States |
17,116 |
12,451 |
10,381 |
12,155 |
16,026 |
|
|
Growth % |
-27% |
-17% |
17% |
32% |
1% |
|
|
Taiwan |
3,918 |
2,703 |
3,657 |
6,606 |
6,185 |
|
|
Growth % |
-31% |
35% |
81% |
-6% |
20% |
|
|
Mainland China (Excluding HK) |
3,607 |
3,595 |
2,337 |
2,456 |
3,311 |
|
|
Growth % |
0% |
-35% |
5% |
35% |
1% |
|
|
Japan |
1,761 |
1,614 |
1,387 |
1,652 |
1,696 |
|
|
Growth % |
-8% |
-14% |
19% |
3% |
0% |
|
|
Hong Kong |
1,265 |
958 |
1,792 |
2,582 |
1,665 |
|
|
Growth % |
-24% |
87% |
44% |
-36% |
18% |
|
|
Other Asia Pacific |
1,458 |
1,032 |
1,157 |
1,420 |
1,223 |
|
|
Growth % |
-29% |
12% |
23% |
-14% |
-2% |
|
|
Other |
1,266 |
1,053 |
724 |
834 |
652 |
|
|
Growth % |
-17% |
-31% |
15% |
-22% |
-14% |
|
|
Total |
30,391 |
23,406 |
21,435 |
27,705 |
30,758 |
|
|
Growth % |
-23% |
-8% |
29% |
11% |
2% |
Source: Company Data, Khaveen Investments
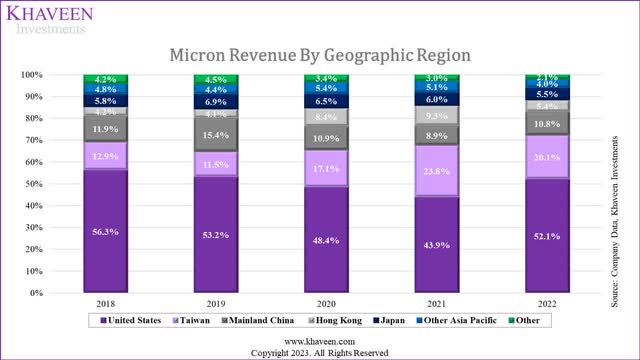
Based on the company’s annual reports, the company breakdowns its revenue “based on the geographic location of customers’ headquarters”. We compiled the company’s geographical revenue breakdown in the table above in the past 5 years. As seen above, the company’s revenue from the US is the highest, representing 52.1% of its total revenue in FY2022. Its revenue from China and Hong Kong accounted for a combined 16.2% of revenue and had increased only slightly from 16% combined in 2018. However, according to the company’s filing, Micron guided that its revenue exposure to China and Hong Kong was “approximately a quarter” or 25% of its total revenue. This is higher compared to its revenue breakdown from its annual report by 8.8%. We believe one of the reasons could be that the company included indirect revenue through distributors as stated in the filing. For example, Arrow Electronics (the largest electronic components distributor) is one of the company’s distributors and up to 40% of its revenues are derived from China.
End Market Breakdown
Micron
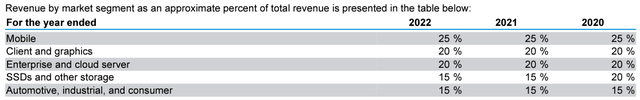
In terms of its revenue breakdown by end markets from its annual report, the largest is Mobile at 25% of revenue followed by Client and graphics, Enterprise and cloud server as well as SSDs and other storage at 20% of revenue each. Lastly, the Automotive, industrial and consumer segment is the smallest at 15% of revenue. As mentioned, the CAC embargo covers “critical information infrastructure” which includes network facilities, thus we believe this affects the Enterprise and cloud server segment. Additionally, we believe the Mobile segment could be impacted as well as highlighted by the company in its latest earnings briefing.
Revenue Impact
Next, in this section, we derived an estimate of the company’s revenue impact due to the CAC decision in a bear, base and bull case scenario:
- Bear Case: For the bear case impact, we assumed the new restrictions on Micron affect its exposure in China and Hong Kong and could impact all segments as the scope of the end markets impacted is not clearly defined. Therefore, we estimated the revenue impact by multiplying Micron’s stated revenue exposure to China (25%) and end markets exposure of 100%.
- Base Case: For the base case impact, we assumed the Chinese restrictions on Micron affect its exposure in China and Hong Kong and could impact its Mobile and Enterprise and cloud server segments. Therefore, we estimated the revenue impact by multiplying Micron’s stated revenue exposure to China (25%) and end markets exposure of 45%. Overall, we estimate an impact of 11.3% for the base case which is in line with management guidance of a “low double-digit percentage” impact.
- Bull Case: For the bull case impact, we assumed the Chinese restrictions on Micron could be limited as the scope of the restrictions remain unclear with the official announcement by the CAC only stating that the network operators should stop using Micron’s products rather than explicitly saying that it must not use Micron’s products. Also, Micron mentioned that the situation remains uncertain and was engaging with the government and customers to mitigate the impact. Therefore, we estimated the revenue impact by multiplying Micron’s stated revenue exposure to China (25%) by 50% as an assumption and end market exposure of 45% to obtain a total impact of 5.6% of revenues.
|
Micron Revenue Impact Estimate |
Bear Case |
Base Case |
Bull Case |
|
Micron Revenue ($ bln) |
30,758 |
30,758 |
30,758 |
|
Share of China Revenue |
25.0% |
25.0% |
12.5% |
|
End Markets Impact ($ bln) |
100% |
45% |
45% |
|
Estimated Impact |
7,690 |
3,460 |
1,730 |
|
Estimated Impact % of Total Revenue |
25.0% |
11.3% |
5.6% |
Source: Micron, Khaveen Investments
Overall, we estimate a revenue impact of between 5.6% (bull case) to 25% (bear case) for Micron due to the new Chinese government restrictions. Furthermore, our base case revenue impact estimate of 11.3% based on our assumption of Micron’s stated revenue exposure to China (25%) and combined Mobile and Enterprise and cloud server segments exposure (45%) is in line with management guidance of the “low double-digit percentage” or 12.5% estimated revenue impact. Thus, our base case estimate of a 4.8% revenue impact is only slightly lower by 1.2% of revenues compared to management’s guidance.
Key Competitors Could Benefit
According to Evercore ISI (EVR), the new Chinese restrictions could risk Micron’s customers shifting to South Korean competitors such as SK Hynix and Samsung (OTCPK:SSNLF). Thus, we examined whether Micron’s competitors could benefit from the restrictions on the company.
|
Micron Revenue Breakdown |
2022 |
|
DRAM |
72.78% |
|
NAND |
25.4% |
Source: Company Data, Khaveen Investments
Micron’s memory revenue is broken down into DRAM and NAND where its DRAM share of revenues is larger than its NAND share of revenues. Its DRAM revenues consisted of 73% of its total revenues followed by NAND at 25.4% of total revenues in 2022.
Market Share
DRAM
TrendForce, Khaveen Investments
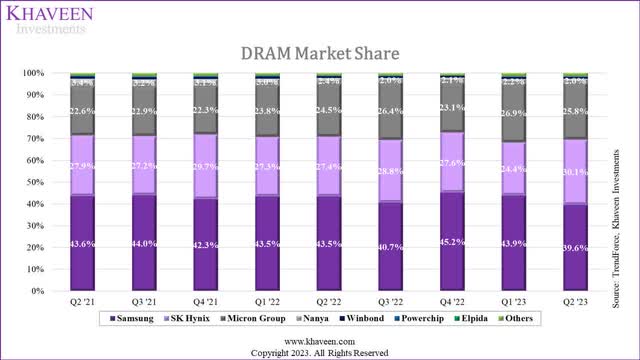
In terms of market share, the DRAM market consists of 3 leading large players which are Samsung, SK Hynix and Micron which cumulatively account for over 95% of the DRAM market. The Chinese companies’ share in DRAM was still insignificant. In Q2 2023, Micron’s market share declined slightly by 1.1% in the prior quarter and Samsung also lost share while SK Hynix’s share increased to 30.1% as the company had higher shipments and ASPs due to DDR5 and HBM according to TrendForce.
NAND
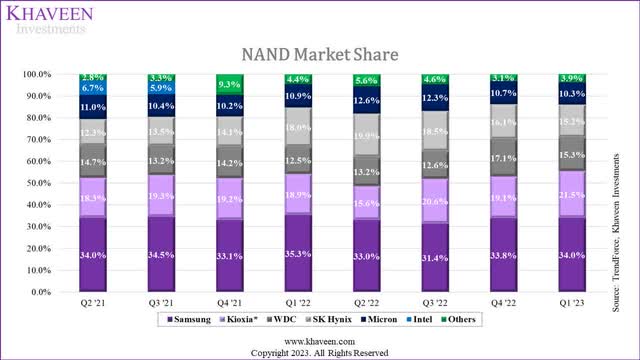
TrendForce, Khaveen Investments
For the NAND market, Samsung, SK Hynix and Micron are also among the top companies in the market but it is more diverse compared to the DRAM market. These 3 companies accounted for 59.5% of the market share combined in Q1 2023. YMTC’s market share is included in the others and has risen since 2021 but still pales in comparison compared to larger competitors.
Technology
NAND
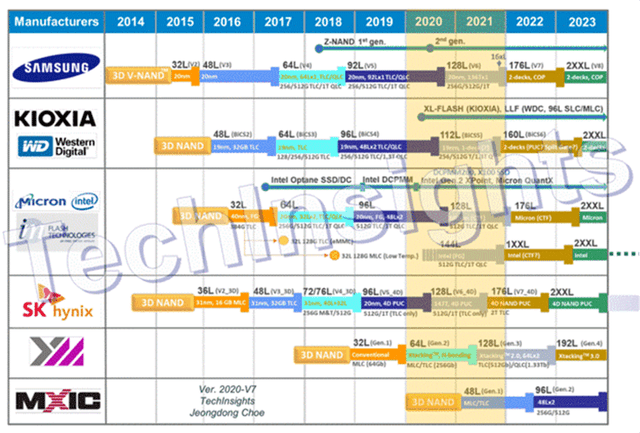
TechInsights
Based on the NAND technology roadmap by TechInsights, most of the top companies have a 232L process for NAND. Advanced process technology nodes are crucial for NAND technology as they bring significant enhancements in performance, power efficiency and manufacturing costs. For instance, Micron stated that its 232L NAND tech achieves fast NAND I/O speeds and allows for greater design flexibility. Additionally, it claims to achieve the highest TLC density per square, resulting in faster, more efficient memory in devices and cost-effective production. Based on the roadmap, YMTC was expected to only have 192L NAND by 2023 but has instead made a leap skipping it directly to 232L NAND in 2023 according to TechInsights which highlights its impressive technological feat.
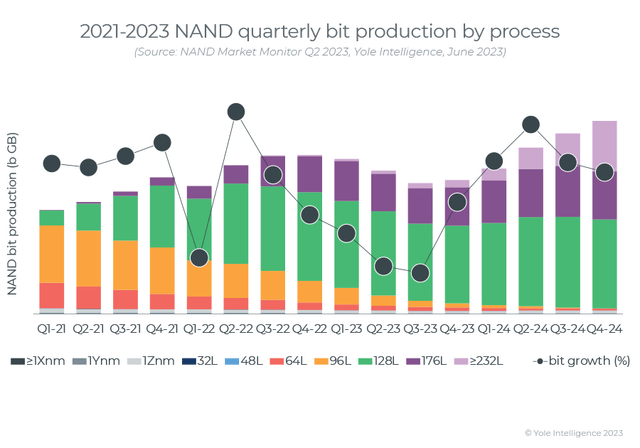
Yole Development
Notwithstanding, based on the chart above of the breakdown of the NAND market production by process technology, the majority of the market production is still on a 128L NAND process while the 176L NAND process is smaller but has been increasing over the past years from 2021. Furthermore, 232L NAND process technologies are expected to increase significantly through 2024 according to Yole Development.
DRAM
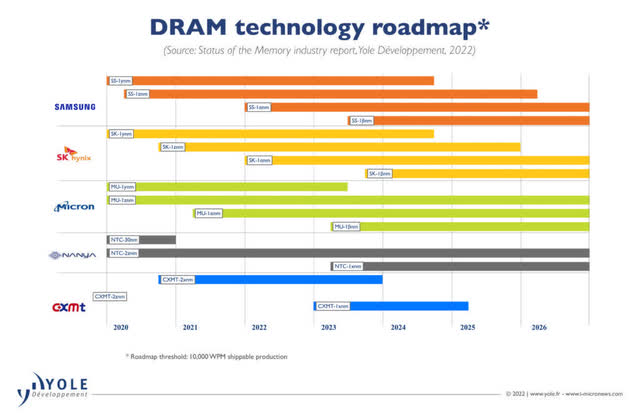
Yole Development
The chart by Yole Development above shows the process roadmap of DRAM where the top three companies are leading with a cutting-edge 1-beta nm process technology in 2023. In contrast, competitors like Nanya (OTCPK:NNYAF) and CXMT, based in Taiwan and China respectively, are using a 1-x nm process technology in 2023, which places them significantly behind the top three players, as 1x nm (19nm-17nm) lags four generations behind the latest 1-beta nm process.
Having the most advanced process technology node is crucial for DRAM as it brings substantial improvements in performance, power efficiency, and manufacturing cost. For instance, Micron’s 1-beta DRAM technology offers approximately a 15% power efficiency enhancement and over a 35%-bit density improvement, featuring a 16Gb per die capacity according to the company. This translates to devices using this technology having faster, more efficient memory, while also being more cost-effective to manufacture.
Geopolitics
While it is expected that the restrictions on Micron could benefit competitors from South Korea such as Samsung and SK Hynix, the US government has advised South Korea against filling the gap left by Micron. Furthermore, the US Department of Commerce was reported to be planning to engage with the Chinese authorities as well as US allied countries to address the actions by the Chinese authorities. The South Korean government has indicated that it will not encourage its companies to fill demand but also has not discouraged them from doing so either according to the South China Morning Post. However, in the company’s latest quarterly earnings, both Samsung and SK Hynix had not explicitly highlighted the China restrictions and whether they would capitalize on the impact on Micron to fill the demand.
Despite the reported pressure from the US government against South Korean companies to fill the demand due to the China restrictions, the US government is reportedly allowing chipmakers such as Samsung and SK Hynix to continue and expand their DRAM and NAND operations in China, permitting them to buy equipment from US suppliers. According to WSJ, the Department of Commerce intended to extend waivers initially granted to foreign chipmakers such as South Korea, which exempt them from US export controls to China. These waivers, due to expire in October, enable US semicon equipment manufacturers to export chip-making tools to China under certain conditions. Therefore, in light of the reports of US government pressure on South Korean chipmakers, we believe the US could change its stance as it had done so with the manufacturing equipment export exemptions Samsung and SK Hynix benefitted from and highlighting their strong bargaining power.
|
Companies |
Q2 2022 |
Q2 2023 |
YoY |
|
Samsung (KRW tln) |
21.08 |
8.97 |
-57.4% |
|
SK Hynix (KRW tln) |
13.81 |
7.31 |
-47.1% |
|
Micron ($ bln) |
8.64 |
3.75 |
-56.6% |
Source: Company Data, Khaveen Investments
Furthermore, we compiled the revenue growth of Micron, Samsung’s memory segment and SK Hynix in Q2 2023 to compare their performance following the announcement of the trade restrictions. As seen in the table, all 3 companies had significantly large negative growth in the period. SK Hynix performed the best among them 3 while Samsung performed the worst. Overall, we believe this highlights Samsung or SK Hynix did not significantly benefit from the restrictions in the quarter.
Chinese Government Subsidies
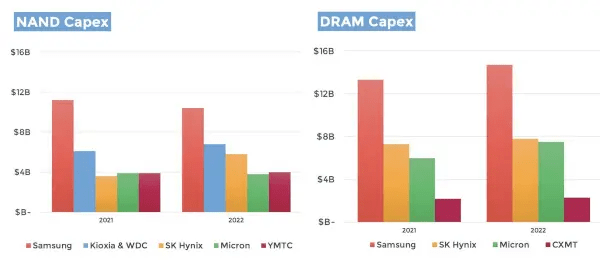
Yole Development
Based on the chart above of the NAND and DRAM capex by company from Yole Development, Micron’s capex is ranked fifth in NAND and third in DRAM. Interestingly, YMTC is ahead of Micron in NAND with a higher capex than the company. Furthermore, in DRAM, CXMT, despite having a very low market share has quite substantial capex in comparison to Micron.
In 2023, according to The Register, despite US trade restrictions, YMTC is set to receive a substantial financial boost of CNY49 bln ($7 bln) from investors with relations with the government, including CNY12.9 bln ($1.9 bln) from China’s semiconductor investment group (the Big Fund). Additionally, other Chinese entities are also investing $5.1 bln in the company.
These investments will double YMTC’s registered capital, surpassing CNY105 bln based on the South China Morning Post. Thus, we believe this highlights the strong financial backing of Chinese memory makers especially YMTC which could pose a threat to Micron.
Summary
Overall, following the newly imposed restrictions on Micron’s products by the Chinese government, we believe that the company’s competitors could benefit from the impact on Micron. We believe Micron’s top competitors, Samsung and SK Hynix would be able to fill the demand of Chinese customers given their strong market position in DRAM and NAND. However, these South Korean chipmakers have been reported to be warned against doing so by the US government, but we believe it may change its stance with the strong bargaining power of these companies as it had provided them with exemptions from the US semiconductor equipment export controls to China. Additionally, we believe Chinese chipmakers are also positioned to capitalize on the ban on Micron’s products. In NAND, we believe YMTC has strong technological capabilities with its 232L NAND and capex that is higher than Micron in NAND and had received additional significant funding from China which could spur its expansion to take advantage of the demand gap due to the ban in NAND. However, in DRAM, we believe CXMT still lags behind the top 3 DRAM companies in terms of process technology, being 4 generations behind them.
Early Signs of Improving Memory Pricing Outlook
In this section, we examined the memory market pricing and analyzed whether the new restrictions have had an impact on the memory market pricing trends. We compiled and updated our pricing data from JCMIT and PCPartPicker in the charts below.
NAND
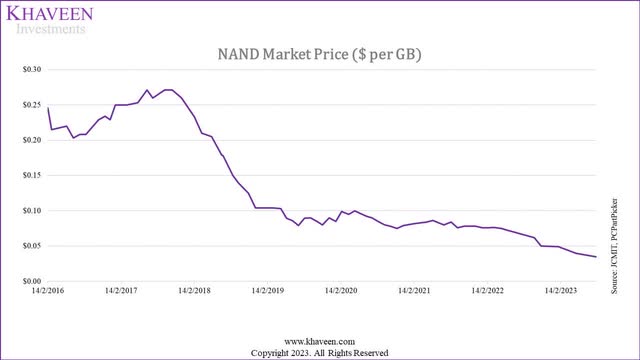
JCMIT, PCPartPicker, Khaveen Investments
Based on the chart above, the NAND market pricing has been trending downwards since 2022. The trend continued throughout 2023 until August 2023. Over the past 1 year, NAND pricing had declined by 58.9% YoY and had not shown any signs of improvement despite the announced restrictions by China on Micron’s products in May 2023. From May to August 2023, NAND pricing further declined by 6.5%.
DRAM
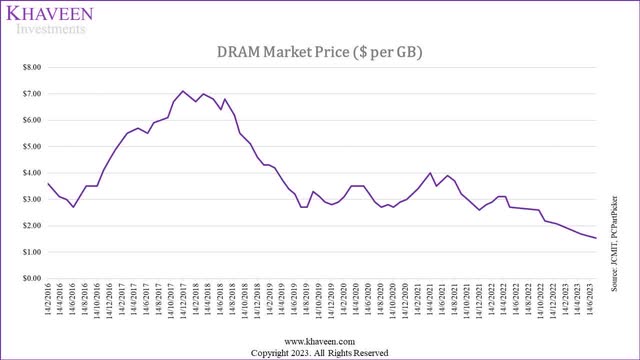
JCMIT, PCPartPicker, Khaveen Investments
Furthermore, the DRAM market pricing has also been trending downwards since 2022 and has continued throughout 2023. Over the past 1 year, DRAM pricing had declined by 60.8% YoY and had not shown any signs of improvement despite the announced restrictions by China on Micron’s products in May 2023. From May to July 2023, NAND pricing further declined by 9.1%.
Inventory Levels
|
Days Inventory Ratio |
2016 |
2017 |
2018 |
2019 |
2020 |
2021 |
2022 |
TTM |
Average |
|
Micron |
138.02 |
136.72 |
158.38 |
218.42 |
207.37 |
163.30 |
208.83 |
307.94 |
167.25 |
|
Samsung |
68.49 |
69.72 |
94.49 |
87.98 |
91.15 |
105.32 |
116.03 |
136.98 |
84.22 |
|
SK Hynix |
66.82 |
67.05 |
84.91 |
94.22 |
98.93 |
114.25 |
154.73 |
172.25 |
92.68 |
|
Inventory Turnover Ratio |
2016 |
2017 |
2018 |
2019 |
2020 |
2021 |
2022 |
TTM |
Average |
|
Micron |
2.64 |
2.67 |
2.30 |
1.67 |
1.76 |
2.24 |
1.75 |
1.19 |
2.47 |
|
Samsung |
5.33 |
5.23 |
3.86 |
4.15 |
4.00 |
3.47 |
3.15 |
2.66 |
5.09 |
|
SK Hynix |
5.46 |
5.44 |
4.3 |
3.87 |
3.69 |
3.19 |
2.36 |
2.12 |
4.57 |
Source: Company Data, Morningstar, Khaveen Investments
We examined the efficiency ratios related to inventory for the leading memory manufacturers: Micron, Samsung, and SK Hynix. According to the data, all three companies have experienced a rise in their inventory, reaching the highest levels observed over the last decade. Notably, Micron stands out with the highest days inventory ratio compared to its competitors, surpassing its own 10-year average. Furthermore, the inventory turnover ratios for all three companies have decreased, reaching their lowest points in the past decade. Compared to our previous analysis, their days inventory ratio had increased TTM and inventory turnover had decreased, which suggests that the inventory levels had not yet shown any significant improvement.
However, Micron provided a positive outlook for inventory levels in the memory market, stating that its end market customers had made progress in reducing their inventory levels in the past quarters.
Customers continued to make progress in reducing their excess inventory in fiscal Q3. Most customer inventories in the PC and smartphone segments are close to normal levels now, consistent with our forecast six months ago. Some of these inventory levels can get distorted by customer attempts to leverage current prices, which are deemed to be transient and unsustainable at these levels, to purchase additional volumes before prices rise significantly. Data center customer inventory is also improving and will likely normalize around the end of this calendar year or somewhat thereafter, depending on the growth in traditional data center spending. – Sanjay Mehrotra, President and Chief Executive Officer
Based on Micron’s annual report, the company’s products are sold to customers directly including smartphone makers like Apple (AAPL) and memory module makers, or through distributors. Its top customers are DRAM module market leader Kingston (KINS) with a 78% market share (12% of revenues) and distributor WPG Group (OTC:WPGHF) (11% of revenues). Seagate (STX), the market leader in HDD (43% market share), also procures NAND flash chips from Micron. Seagate’s inventory levels had decreased by 27% to $1.14 bln compared to $1.57 bln compared to a year ago, which highlights the decreasing inventory levels of the company. Moreover, in our previous analysis of TSMC (TSM), we highlighted the decreasing inventory levels in the PC and smartphone end markets. According to TrendForce, PC and smartphone makers have been reducing their memory inventory.
Furthermore, according to TF International Securities, Micron and Samsung had begun raising their price quotes by 10%. This follows after YMTC reportedly raised its NAND prices by up to 5% according to the Taiwan Economic Times. Previously, Micron, Samsung and SK Hynix were believed to be reviewing their prices based on Business Korea. In relation, NH Investment & Securities claimed that Micron would “stop accepting low-price orders for both DRAM and NAND” from May 2023.
All in all, despite the new trade restrictions by China on Micron’s products, we believe that the market pricing had not been impacted significantly by the restrictions as NAND and DRAM pricing continued to decrease since May 2023 when the restrictions were announced. We believe the limited impact could be attributed to the elevated market inventory situation where the top 3 companies still have high inventory levels as indicated by their above-average days inventory and inventory ratios. Notwithstanding, we continue to expect a pricing recovery with reports indicating that top memory makers, including Micron, have started raising prices. We believe the company was not taking orders because the prices were too low and could benefit from higher prices as well as higher shipments once market pricing recovers.
Risk: Harder Crackdown by China
We believe one of the critical risks following the recent developments by Chinese regulators on Micron is the uncertainty of the situation. As discussed, we estimated a base case revenue impact of 11.3% due to the new restrictions on the company. However, the company stated that its total revenue exposure to China is a quarter of its revenues. Given the vague scope of the restrictions which even management acknowledged, we believe the company would be impacted significantly if the regulators impose a broader crackdown against Micron amid high geopolitical tensions between the US and China. We recall that Micron previously guided a “low-single to high-single digit percentage” impact but raised it to a “low double-digit percentage” impact. That said, the company did highlight that it was engaging with regulators and customers to mitigate the impact. Overall, the situation remains highly uncertain.
Valuation
|
Micron Revenue Projection ($ bln) |
2020 |
2021 |
2022 |
2023F |
2024F |
2025F |
|
DRAM |
14.51 |
20.04 |
22.39 |
14.18 |
15.98 |
17.92 |
|
Growth % |
38.1% |
11.7% |
-36.6% |
12.7% |
12.1% |
|
|
NAND |
6.13 |
7.01 |
7.81 |
5.41 |
5.84 |
6.50 |
|
Growth % |
14.3% |
11.5% |
-30.8% |
7.9% |
11.3% |
|
|
Others |
0.79 |
0.66 |
0.56 |
0.37 |
0.25 |
0.27 |
|
Growth % |
-17.0% |
-14.9% |
-34.9% |
-32.9% |
||
|
Total Revenue |
21.44 |
27.71 |
30.76 |
19.95 |
22.06 |
24.68 |
|
Total Growth % |
29.25% |
11.02% |
-35.12% |
10.57% |
11.86% |
Source: Company Data, Khaveen Investments
We updated our projections from our previous analysis with its Q3 FY2023 results and also factored in our base case impact to Micron’s revenues at 11.2% of revenues starting from Q4 FY2023 and revised our revenue growth forecast to -35.12% but we still anticipate a positive recovery beyond that at 10.57%.
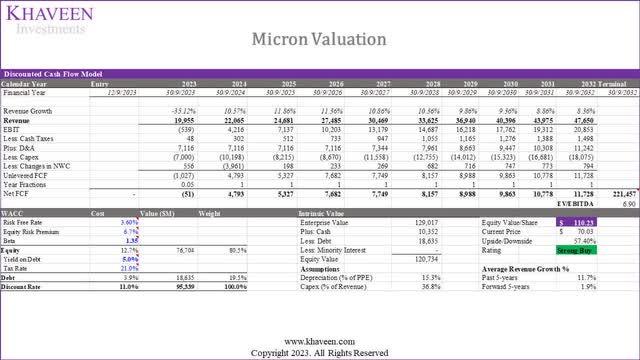
Khaveen Investments
Based on our DCF model, we obtained an upside of 57.4% based on a discount rate of 11.2% (company’s WACC). Furthermore, we applied a discount of 30% to account for the Molodovsky Effect as explained in our previous analysis, in which we derived an upside of 10.18%.
|
Current Price |
Valuation Price |
Upside |
|
|
Valuation (‘DCF’) |
$ 70.03 |
$ 110.23 |
57.40% |
|
Molodovsky Effect Discount (30%) |
$ 77.16 |
10.18% |
Source: Khaveen Investments
Verdict
All in all, we believe that new Chinese government restrictions may impact Micron’s revenue ranging from our bear case of 25% of revenue to 5.6% of revenue in the bull case. Our base case estimate of an 11.3% revenue impact aligns with Micron’s guidance of a “low double-digit percentage” or 12.5% impact, only slightly lower by 1.2% compared to management’s guidance. In light of these restrictions, we anticipate that Micron’s competitors, particularly Samsung and SK Hynix, could benefit due to their strong positions in the DRAM and NAND markets. Despite reported warnings from the US government, we believe they may reconsider, given these companies’ bargaining power and previous exemptions from US export controls to China. Furthermore, we believe that Chinese chipmakers, including YMTC in NAND, are also poised to capitalize on the ban, with technological capabilities and funding for expansion. Despite the restrictions, NAND and DRAM pricing has not been significantly impacted, likely due to high market inventory levels among the top 3 companies. However, we anticipate a pricing recovery, with memory makers, including Micron, already raising prices. Thus, we believe Micron could benefit from higher prices and increased shipments once market pricing rebounds.
Overall, we maintain our Buy rating on the company but with a lower price target of $77.16 which is slightly lower compared to our previous analysis of $83.97 due to a lower growth forecast at a 5-year forward average of 1.9% (6.8% previously) accounting for the potential impact from the new Chinese restrictions on Micron as well as its dismal Q3 FY2023 performance which saw its total revenue declined by 57% YoY. Notwithstanding, we forecasted the company’s revenue to recover beyond 2023 as we anticipate the market to stabilize.
Read the full article here
