Note: All amounts discussed are in Canadian Dollars unless disclosed otherwise
We were simply enamored at how MEG Energy Corp. (TSX:TSX:MEG:CA) went from close to $3 billion in net debt in 2019 to around $700 million net debt by the close of 2023. All this while the company was returning cash to the shareholders via buybacks. The plan was much of the same for 2024, with the addition of growth projects to capitalize on the strong balance sheet. We still went with a hold for the stock after reviewing the numbers back in February of this year. We liked it better via options due to the high implied volatilities, which in our opinion were unjustified given the trajectory of its net debt to EBITDA. We chose an option that, if assigned, would get us the stock at the price we wanted.
MEG Energy: How We Are Playing It For 2024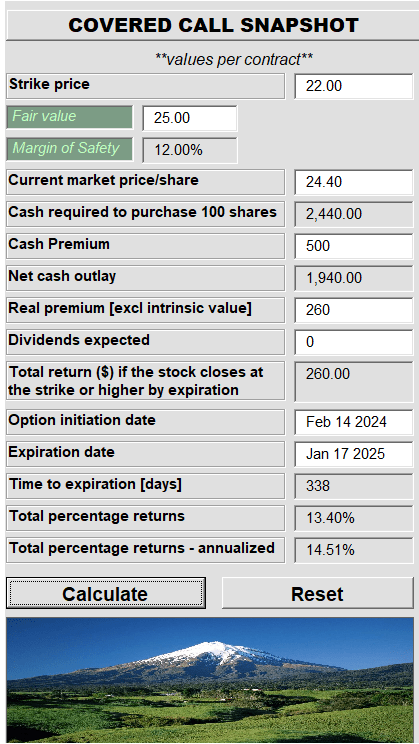
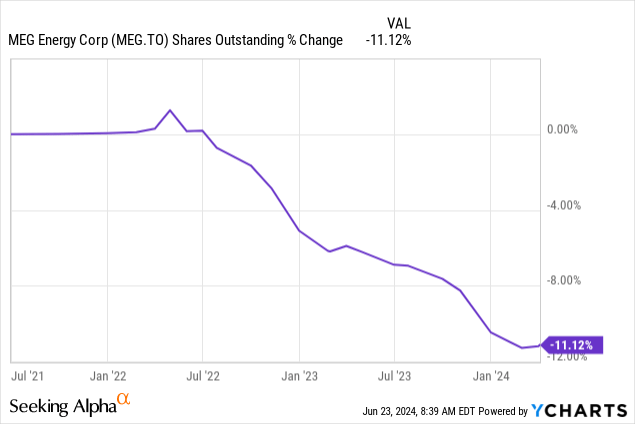
The stock price has jumped higher since then and while direct buyers have made over 14% since then, our option marches deeper in the money without the rollercoaster.
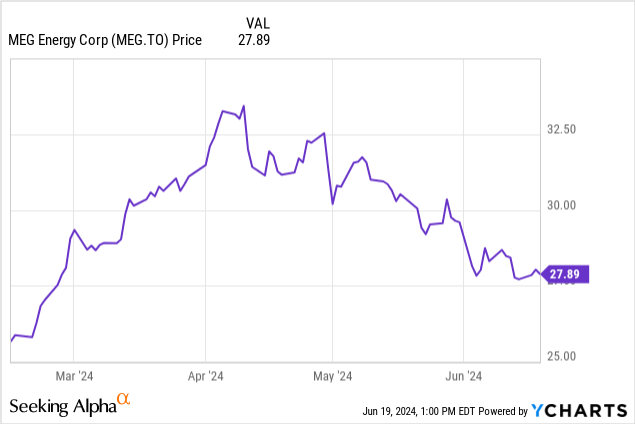
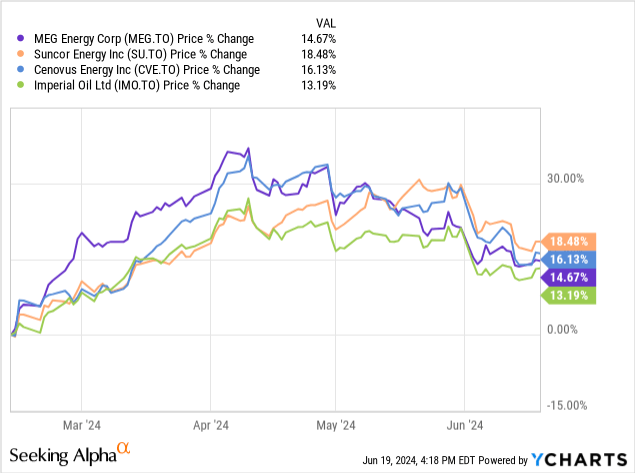
We can see that the stock had soared quite a bit higher during this period, but has returned a lot of those price gains. It is hardly alone in this, as the decline is more a function of the current sentiment towards the sector rather than disdain towards MEG per se.
In our last piece, we had reviewed 2023, without the actual Q4 numbers, using the first three quarters as a beacon of how the year would close. Two results have been released since then, the Q4-2023 and the Q1-2024 numbers. Lets take a peak at them today.
Q1-2024
Investor Presentation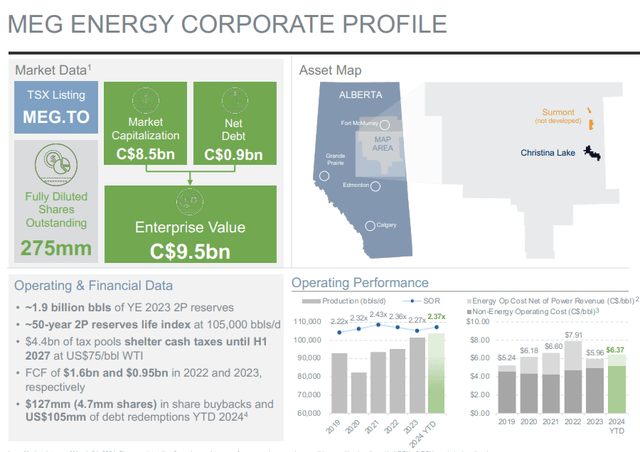
Q1-2024 results were solid with bitumen production edging past 104,000 barrels per day alongside 2.37 steam-oil ratio. This was in line with estimates, and MEG produced a $1.19 per share of adjusted cash flow. The slide below nicely breaks down how MEG deployed that cash with debt redemption and share buybacks.
Investor Presentation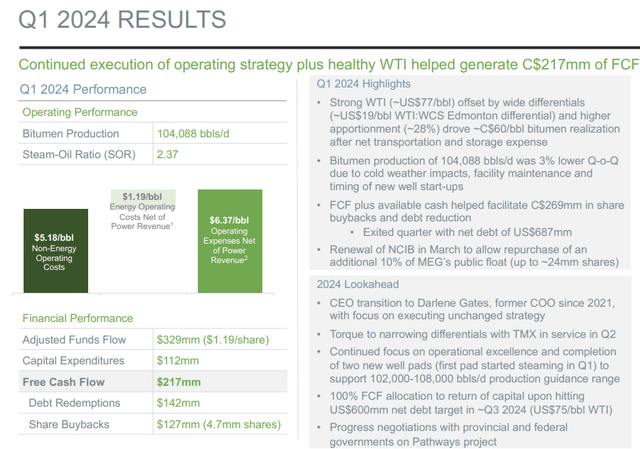
While the focus has been on reducing debt and returning cash, investors have also been given a modest growth profile to focus on. The cash costs of these projects are moderate, and they will increase capacity from the current 105,000 barrels per day to 125,000 barrels per day by 2026.
Investor Presentation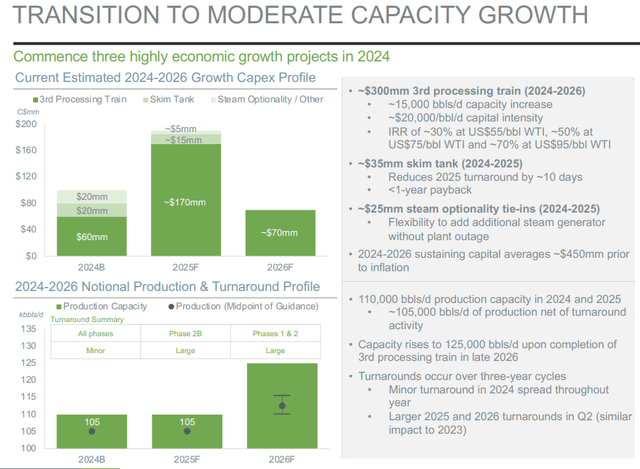
MEG fine-tuned its guidance, with most numbers remaining where they were in late 2023.
Investor Presentation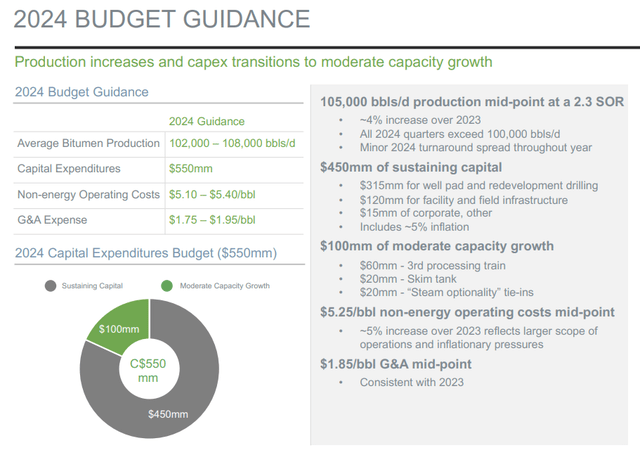
Outlook
MEG has moved from a company at risk of bankruptcy to one that might get an investment grade rating in 2 years.
Investor Presentation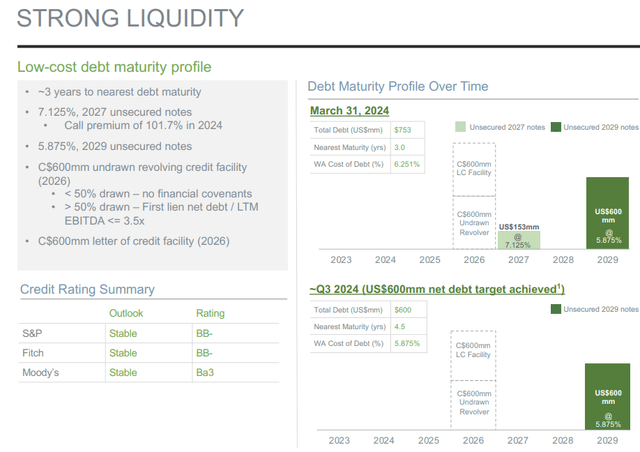
The debt reduction continues systematically, and MEG has balanced that with some rather substantial amounts of share buybacks.
Investor Presentation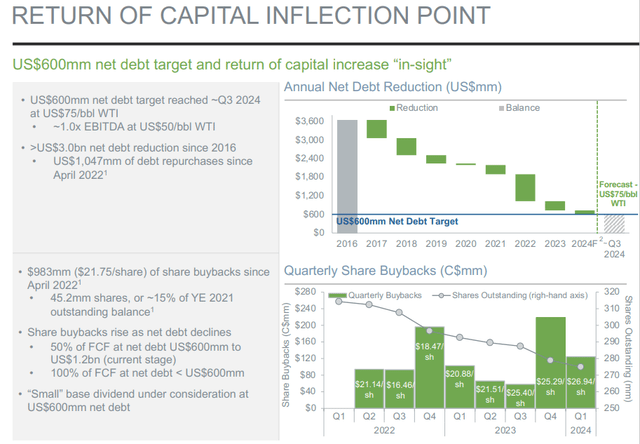
It is now within striking distance of its target of $600 million USD of net debt. At that point, returns to shareholders reach 100% of free cash flow. We think we will be there by the end of Q3-2024, but the exact timing is rather irrelevant for the investment case. The share count reduction is fairly visible even at lower capital return rates.
Also, while the credit rating agencies put this firm well below where Suncor Energy (SU:CA) and Imperial Oil (IMO:CA) stand, there is really no threat to the company’s viability. This is true even if we have a sustained period of sub $50 USD oil. Even the WCS-WTI differential threat is now something of a footnote for history books, as TMX start-up has removed that. While the spread may be higher or lower, a repeat of 2018 is extremely unlikely with the volume buffer in the system.
Investor Presentation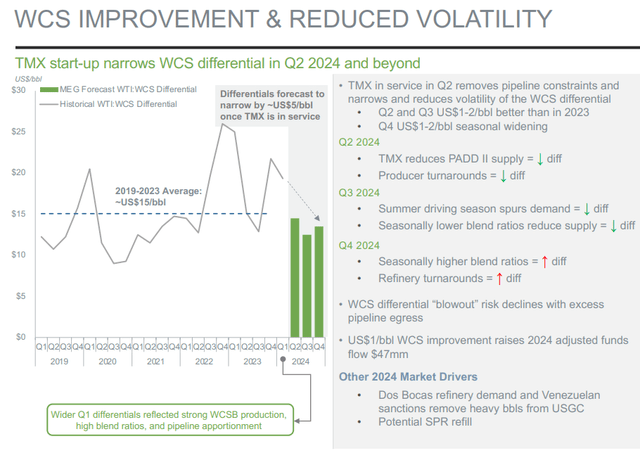
What will drive the returns here is just how much you are ready to pay for a low growth energy company. That in turn will depend on what investors believe oil will average over the next 5-7 years. If that number is $60 USD per barrel, then you can expect MEG to trade at low multiples as investors will discount the current earnings and try and value it off trough cash flow. So in such an environment, you would expect 15% -17% free cash flow yield multiple at $75 USD oil. In other words, MEG will look cheap because investors are pricing far lower free cash flow in the future. On the other hand, if the market believes $90 USD is more likely an average, MEG can indeed double from even here, in 2 years.
Our framework of valuation here comes from the expectation that oil will average at least $75 USD per barrel over the next 3 years. But we expect those prices to be fairly volatile. In that climate, the best bet is to rotate to the most undervalued names. We can tell you that currently, MEG is definitely not it.
You can get a sense of that with the forward EV to EBITDA multiples relative to SU, IMO, Cenovus Energy (CVE:CA). We even threw in Whitecap Resources (WCP:CA) and we will get to the rationale of that in a minute.
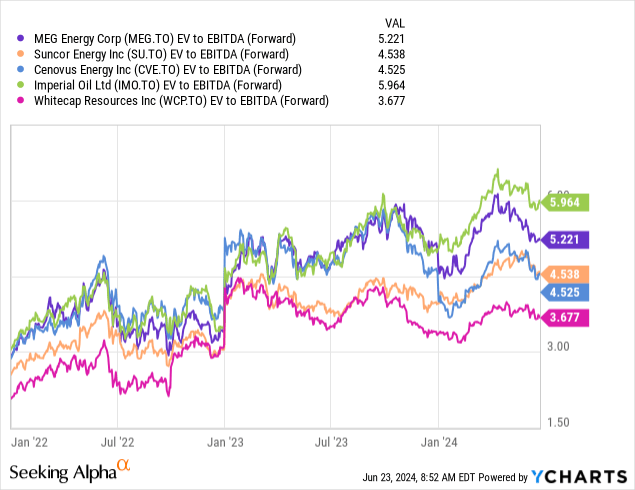
But looking at the oil sands peers, we see IMO and MEG about as equally expensive. Yes, IMO carries a higher EV to EBITDA multiple, but that firm has a refining diversification and an AA- credit rating. The pricing on both SU and CVE is really off here. The two are resoundingly cheap relative to MEG. In our world the two should trade 0.5-1.0 EV to EBITDA multiple higher than MEG and here it is the other way around. Our favorite in the energy space, though, remains WCP. The stock is trading at a dead EV to EBITDA multiple, and there is a lot of room for the multiple to expand. There is also a lot of room for the EBITDA to come in higher for WCP as analysts are pricing in very low natural gas prices. Higher natural gas prices won’t move the needle for the remaining 4 as they are almost 100% oil. At present, we see MEG as a “hold” and we just cannot support the valuation premium here, regardless of how bullish we might get on oil prices.
Please note that this is not financial advice. It may seem like it, sound like it, but surprisingly, it is not. Investors are expected to do their own due diligence and consult a professional who knows their objectives and constraints.
Editor’s Note: This article discusses one or more securities that do not trade on a major U.S. exchange. Please be aware of the risks associated with these stocks.
Read the full article here
