Introduction
The Phoenix-based Freeport-McMoRan (NYSE:FCX), the world’s largest publicly-traded copper company, released its first quarter 2023 results on April 21, 2023.
Note: This article updates my preceding article, published on February 28, 2023. I have been following Freeport-McMoRan since Sept. 2019.
CEO Richard Adkerson said in the conference call:
As we move forward, copper miners will be required to expand production to meet demand. At Freeport, we’re in a strong position to develop new sources of copper supply to grow our business from our vast brownfield resources and also to grow our business from the rapidly developing leach technology and the supporting data analytics.
1 – First Quarter 2023 Results Snapshot
Freeport-McMoRan posted a quarterly profit of $663 million or $0.46 per share, beating analysts’ expectations despite a lower-than-expected revenue. Adjusted earnings per share came in at $0.52 per share. Below are the results and production snapshot for 1Q23 from the presentation.
FCX 1Q23 Highlights (FCX Presentation)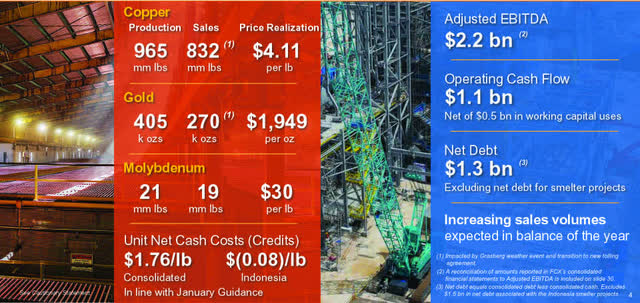

Revenues fell 18.4% year over year to $5,389 million in 1Q23. Lower Copper prices and lower production hurt Freeport-McMoRan results in 1Q23.
Consolidated production totaled 965 billion pounds of copper, 405 thousand ounces of gold, and 21 million pounds of Molybdenum in the first quarter of 2023. Unit cash cost per Cu Lbs was $1.76 in 1Q23 from $1.33 in 2022.
Consolidated sales from mines were 832 million pounds of copper. The company sold 270K ounces of gold and 19 million pounds of Molybdenum in the third quarter.
CEO Richard Adkerson said in the conference call:
Our team in Indonesia, once again, proved resilient in overcoming a major flood event. Now, we’re accustomed to dealing with rainfall at Grasberg. It’s located high in the mountains of New Guinea, one of the wettest places on the globe.
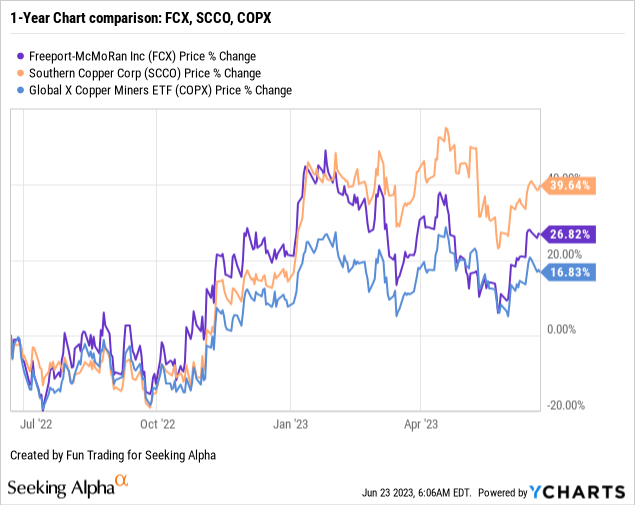
2 – Stock Performance
Freeport-McMoRan has slightly outperformed the COPX ETF. FCX is now up 27% in one year.

3 – Investment Thesis
Investing in FCX long-term is a good idea if you believe copper has a bright future, as I do, even if 2023 may turn bearish for the metal. I think the company will perform well long term, and I have owned FCX for many years.
Freeport-McMoRan offers a great business model from a long-term investment perspective relative to gold and copper mining. The company is one of the most prolific producers of copper and produces a significant amount of gold from its Grasberg mine in Central Papua, Indonesia.
However, FCX is subject to China for business, with strong demand expected for copper. Unfortunately, the rebound that many analysts predicted confidently earlier this year is not happening as expected.
FCX 1-Year Chart Gold, Copper, Silver (Fun Trading StockCharts)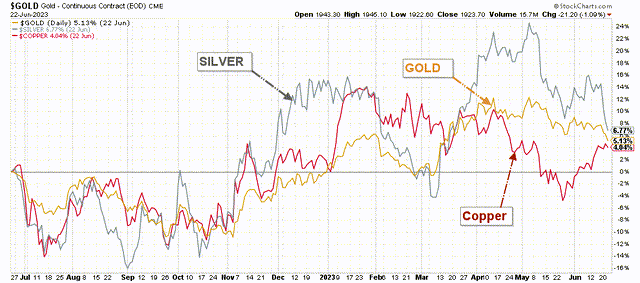

Thus, the strategy that I recommend is to trade 50% LIFO of your total position. It will let you keep a core long-term position for higher ground and enjoy a secure dividend which hopefully will be higher in 2024. By trading LIFO, you always sell the most recent purchases, whereas your core long-term is untouched.
Freeport-McMoRan – 1Q23 – Balance Sheet and Trend History – The Raw Numbers
| Freeport-McMoRan | 1Q22 | 2Q22 | 3Q22 | 4Q22 | 1Q23 |
| Total Revenues in $ Million | 6,603 | 5,416 | 5,003 | 5,758 | 5,389 |
| Net income in $ Million | 1,527 | 840 | 404 | 697 | 663 |
| EBITDA $ Million | 3,329 | 2,262 | 1,515 | 2,188 | 2,088 |
| EPS diluted in $/share | 1.04 | 0.57 | 0.28 | 0.48 | 0.46 |
| Cash from Operations | 1,691 | 1,621 | 758 | 1,069 | 1,050 |
| Capital Expenditure In $ Million | 723 | 863 | 836 | 1,047 | 1,121 |
| Free Cash Flow in $ Million | 968 | 758 | -78 | 22 | -71 |
| Total Cash $ Million | 8,338 | 9,492 | 8,578 | 8,146 | 6,852 |
| Total Long-term Debt in $ Million | 9,621 | 11,092 | 10,690 | 10,620 | 9,635 |
| Quarterly Dividend $/share |
0.15 |
0.15 |
0.15 |
0.15 |
0.15 |
| Shares outstanding (diluted) in Billion | 1,469 | 1,457 | 1,435 | 1,439 | 1,443 |
Source: Company news
Analysis: Revenues, Free Cash Flow, Mineral Reserves, and Copper/Gold/Molybdenum Production
1 – Revenues were $5.39 billion for the first quarter of 2023
FCX Quarterly Revenues History (Fun Trading) The first quarter of 2023 revenue was $5.389 billion, down 6.6% from the same quarter a year ago and up 15.1% sequentially.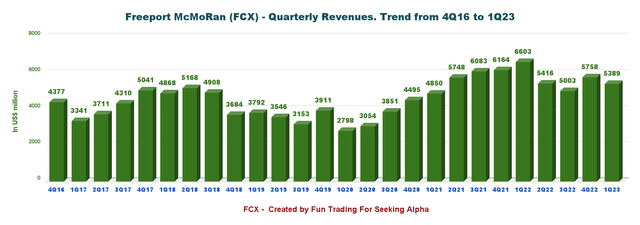

The net income was $663 million or $0.46 per diluted share, compared to $1,527 million or $1.04 in the same quarter a year ago.
The adjusted net income attributable to common stock was $0.52 per share.
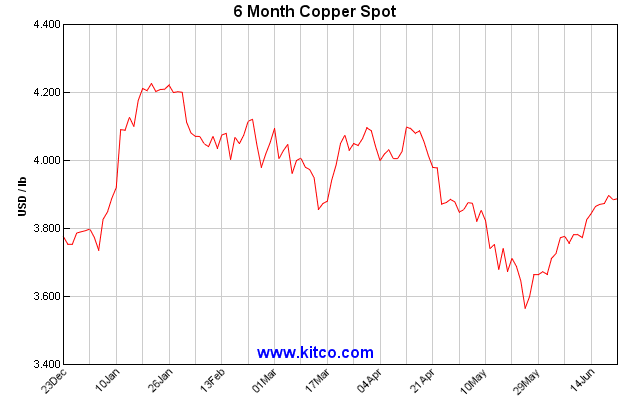
One critical element when it comes to FCX is the copper price. The average was 4.11 per pound in 1Q23, down 11.8% year over year. However, the copper price dropped significantly more recently and recovered from the $3.50 per pound realized in 3Q22, which is still below $4 per pound.
FCX Quarterly Copper Price (Fun Trading) Copper price 6-month History (KitCo)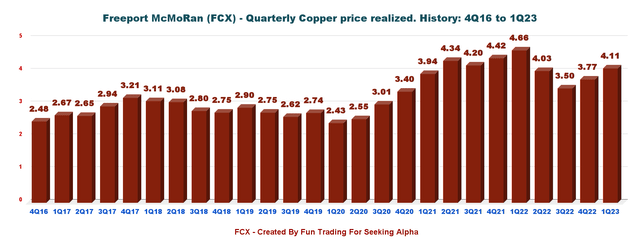


2 – Free cash flow was a loss of $71 million in the first quarter of 2023
FCX Quarterly Free Cash Flow History (Fun Trading) Note: I calculate the generic free cash flow using the Cash from operating activities minus CapEx. Trailing 12-month free cash flow was $631 million, with a loss of $71 million in 1Q23. Despite falling free cash flow this quarter, the company maintained a quarterly dividend of $0.15 per share in 1Q23. On March 22, 2023, FCX declared cash dividends totaling $0.15 per share on its common stock (which included a base cash dividend of $0.075 per share and a variable, performance-based cash dividend of $0.075 per share) Note: The dividend may drop to $0.075 per share next quarter.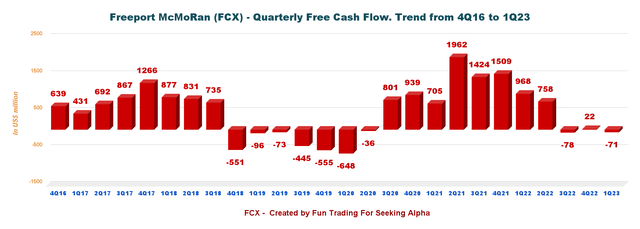

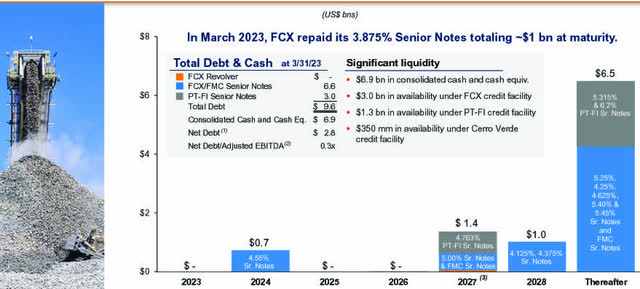
3 – Net debt is down to $2.78 billion in 1Q23
FCX Quarterly Cash versus Debt History (Fun Trading) FCX Debt Profile (FCX Presentation)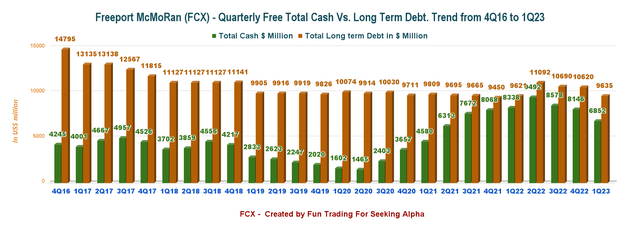


4 – Metal Production Analysis – Copper/Cu, Gold/Au, and Molybdenum/Mo
4.1 Gold and Copper Production
FCX Quarterly Production per Metals (Fun Trading) Copper Production decreased 4.4% to 965 million pounds (net 832 million pounds) from 1,009 million pounds in the same quarter a year ago (see chart above). The decrease in copper and gold sales was due to the deferral of sales recognition for around 110 Mlbs associated with the PT Smelting tolling arrangement. FCX also experienced lower operating rates at the Grasberg Mine due to a significant weather event that temporarily disrupted operations in February.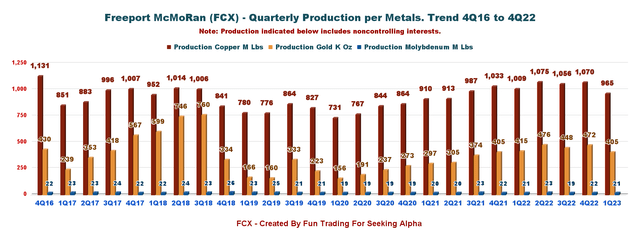

The gold production increased to 405K oz (net 270K ounces), and 21 Mlbs of Molybdenum was produced (net 19 Mlbs).
Below are the copper, gold, and molybdenum prices received by Freeport-McMoRan over the past five quarters:
| Price | 1Q22 | 2Q22 | 3Q22 | 4Q22 | 1Q23 |
| Copper price realized – Cu per pound | 4.66 | 4.03 | 3.50 | 3.77 | 4.11 |
| Gold price Realized – Au per ounce | 1,920 | 1,827 | 1,683 | 1,789 | 1,949 |
| Molybdenum price realized – Mo | 19.30 | 19.44 | 17.05 | 18.94 | 30.32 |
Source: Fun Trading
4.2 Production of Copper, Gold, and Molybdenum per mine in 1Q23
FCX Quarterly Production per Metals per Mine (Fun Trading)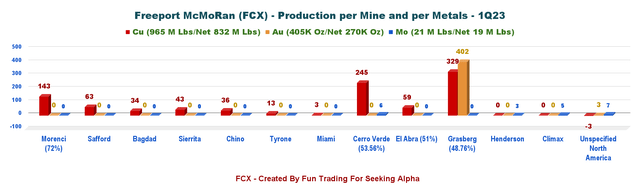

Note: The average net cash costs were $1.76 per pound of copper in the first quarter of 2023.
FCX Production details (FCX Presentation)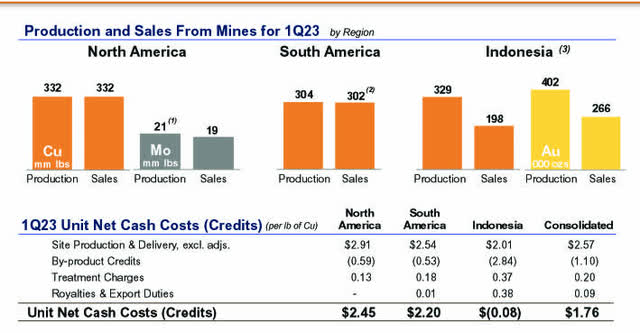

4.3 Reserves situation as of 12/31/2022 (unchanged)
FCX Reserve 2022 (FCX Presentation)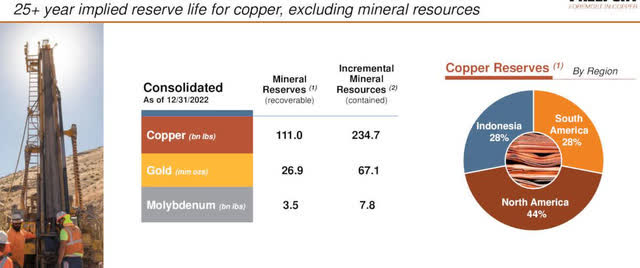

5 – Production outlook for 2023 and other data
Production for 2023 is expected to be 4.1 billion pounds of copper, 1.8 Moz of Gold, and 79 Mlbs of Molybdenum at a unit net cash cost of $1.51 per pound (by-products).
CapEx for 2022 is expected to be $3.5 billion, excluding Indonesia smelter projects CapEx.
FCX 2023 Outlook (FCX Presentation) FCX TA Chart Short-term (Fun Trading StockCharts)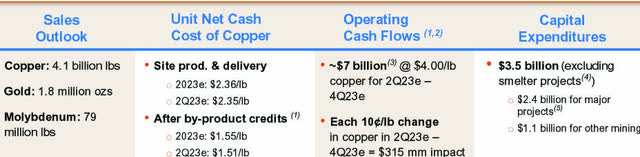
Technical Analysis (short-term) and Commentary
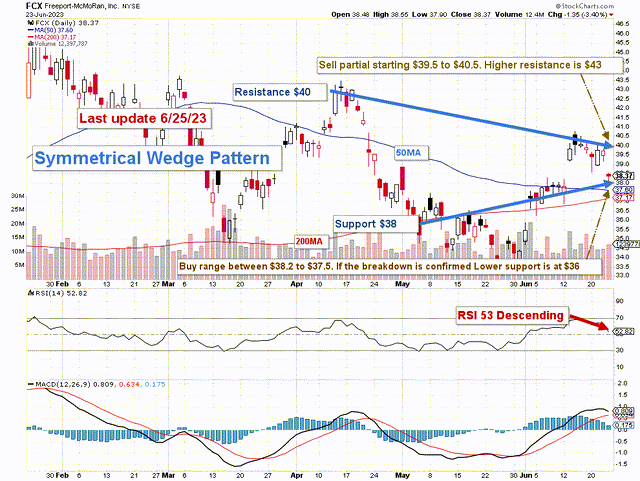


Note: The chart is adjusted for the dividend.
FCX forms a Symmetrical Wedge (or triangle) pattern with a resistance of $40 and support at $38.
The symmetrical triangle is a chart that can be recognized by its lower highs and higher lows. When two trend lines converge with the converging trend lines connecting and containing several peaks and troughs, then this pattern is indicated.
FCX Symmetrical Triangle (Option StrategiesInsider)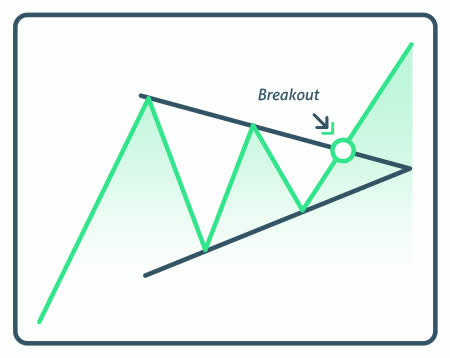

Once one of those peaks “break out” of this barrier, it can indicate a powerful bullish or bearish movement that investors can take advantage of if they know how to look for it. If the breakout point is manifested at a trough point, this can indicate a strong movement into bear territory and an excellent indication that it is time to get out. If the breakout point is at a peak, this can indicate a bull movement and a good time to invest.
The trading strategy that I recommend is to trade LIFO for about 50% of your FCX position. I suggest selling partially in the $39.5 and $40.5 range and waiting for a retracement to buy between $37.5 and $38.2 with possible lower support at $36.
Watch the price of copper like a hawk.
Warning: The TA chart must be updated frequently to be relevant. It is what I am doing in my stock tracker. The chart above has a possible validity of about a week. Remember, the TA chart is a tool only to help you adopt the right strategy. It is not a way to foresee the future. No one and nothing can.
Read the full article here