Introduction
Fortuna Silver Mines (NYSE:FSM) released its third-quarter 2023 production results on October 5, 2022.
Note: This article updates my May 19, 2022, article.
Fortuna Silver Mines owns five production mines, including the Séguéla Mine in the Ivory Coast, which started to produce on May 24, 2023.
FSM Map Assets (FSM Presentation)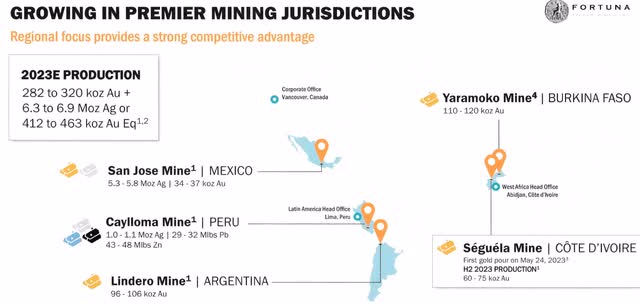
Third Quarter Gold and Silver Production Commentary
1 – 3Q23 Gold and Silver Production
For 3Q23, Fortuna Silver Mines produced 1,680,751 ounces of silver and 94,821 ounces of gold.
FSM Quarterly Gold and Silver Production History (Fun Trading)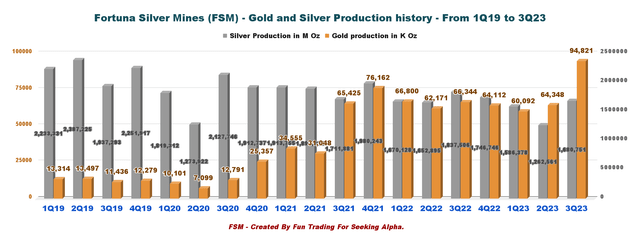
Production detail per Mine:
| Production per Mine | GOLD Oz | SILVER Oz | LEAD K Lbs | ZINC K Lbs |
| Lindero Mine, Argentina | 20,933 | 0 | 0 | 0 |
| Yaramoko Complex Burkina Faso | 34,036 | 0 | 0 | 0 |
| Seguela Mine | 31,498 | 0 | 0 | 0 |
| San Jose Mine, Mexico | 8,205 | 1,372,530 | 0 | 0 |
| Caylloma mine Peru | 149 | 308,221 | 10,337 | 14,037 |
Source: Fun Trading
The increase in gold production was mainly due to Séguéla’s first full quarter of production and steady operating performance across all mines, as shown above.
It translates to a Production in Gold Equivalent Ounces of 128,671 GEOs, up 26.3% YoY.
FSM Quarterly GEO Production History (Fun Trading)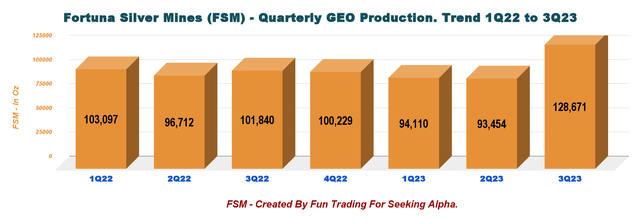
GEOs include gold, silver, lead, and zinc and are calculated using the following metal prices: $1,924/oz Au, $23.70/oz Ag, $0.97/t Pb, and $1.10/t Zn or Gold/Silver ratio of 1:81.19, Gold/Lead = 1:0.90, Gold/Zinc = 1:0.79.
FSM Quarterly Gold and Silver Price History (Fun Trading)
- The higher year-over-year gold production is mainly due to the production at the Séguéla Mine. Production was 31,498 Au Oz this quarter and is expected to be 60K to 75K Au ounces for H2 2023. Life of the Mine is 8.8 years, with an AISC range of $880-$1,080 per ounce.
FSM Seguela Mine (FSM Presentation October 5)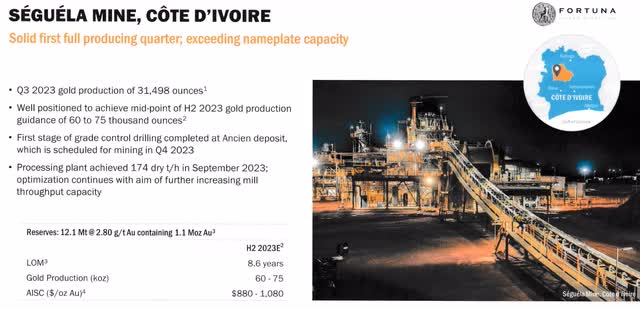
- Also, the company announced that Yaramoko’s annual gold production guidance was revised upwards to 110K to 120K ounces, an increase of approximately 14%. The increased production at Yaramoko was due to higher average grades and greater widths of mineralization encountered in Zone 55 development headings.
- Lindero, San Jose, and Caylloma also showed steady performance in the quarter, positioning Fortuna to achieve its annual production guidance range.
Fortuna Silver Mines reiterates its 2023 annual production guidance range of 6.3 to 6.9 Moz of silver and 282K to 320K ounces of gold or between 412,000 and 463,000 gold equivalent ounces, including lead and zinc by-products.
FSM 2023 Guidance (FSM Presentation October 5)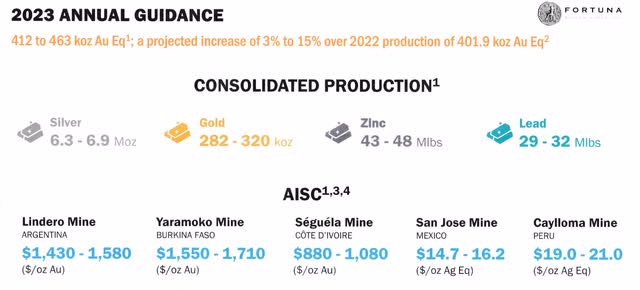
2 – Gold and Silver Prices History
The gold price was $1,924 per ounce, and the silver price was $23.70 per ounce.
FSM Quarterly Gold and Silver Price History (Fun Trading)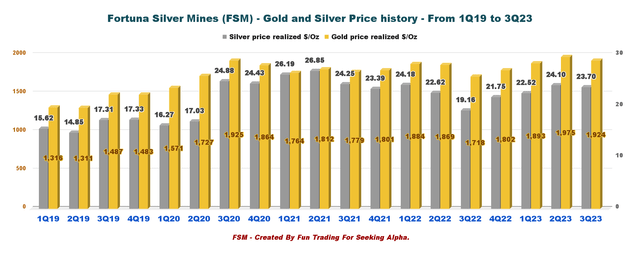
Unfortunately, weakening gold and silver prices are putting pressure on FSM. Gold is now up 6.5% on a one-year basis after tumbling the past few weeks. However, I believe it is an excellent time to accumulate FSM.
FSM 1-Year Chart Gold, Silver, Copper (Fun Trading StockCharts)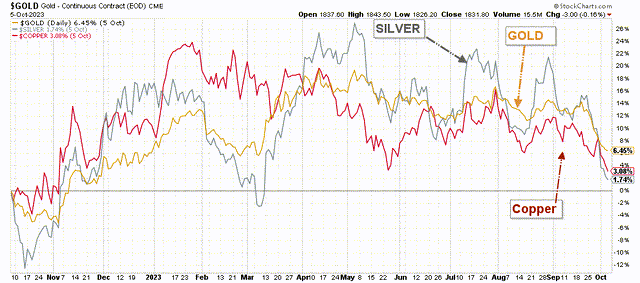
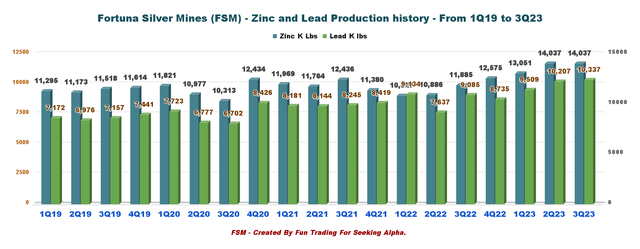
3 – Zinc and Lead Production History (Caylloma Mine)
Production in 3Q23 for lead was 10.337 Mlbs and 14.037 Mlbs for zinc.
FSM Caylloma Mine (FSM Presentation) FSM Quarterly Production Lead and Zinc History (Fun Trading)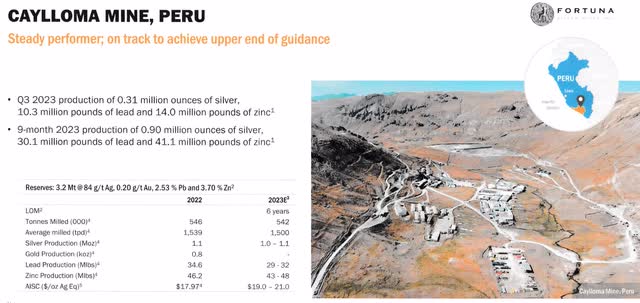
Technical Analysis (Short-Term) and Commentary
FSM TA Chart (Fun Trading StockCharts)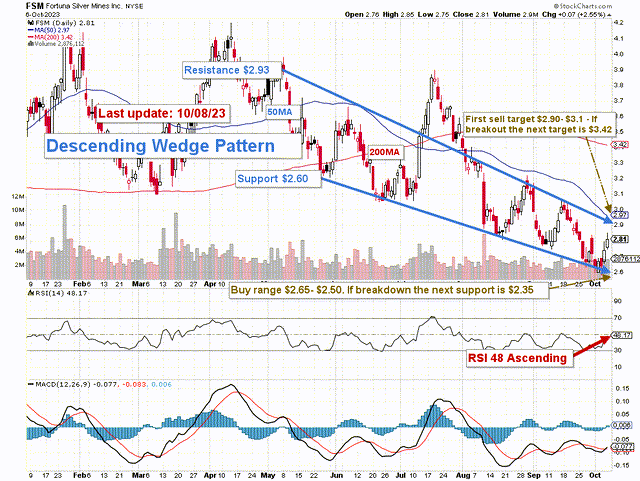
FSM forms a descending or falling wedge pattern, with resistance at $2.93 and support at $2.60. The Falling Wedge is a bullish pattern that suggests potential upward price movement.
I regularly recommend keeping a core long-term position and using about 60% to trade FSM short-term LIFO. It allows you to wait for a higher final price target for your core-long position, which I see between $4 and $5.
I suggest selling partially between $2.90 and $3.10, with possible upper resistance at $3.82, and waiting for a retracement between $2.65 and $2.50, with likely lower support at $2.35.
Thus, watch the gold and silver prices like a hawk.
Warning: The TA chart must be updated frequently to be relevant. It is what I am doing in my stock tracker. The chart above has a possible validity of about a week. Remember, the TA chart is a tool only to help you adopt the right strategy. It is not a way to foresee the future. No one and nothing can.
Read the full article here
