Editor’s note: Seeking Alpha is proud to welcome Bull Sheep Research as a new contributor. It’s easy to become a Seeking Alpha contributor and earn money for your best investment ideas. Active contributors also get free access to SA Premium. Click here to find out more »
Duolingo (NASDAQ:DUOL) is a global language learning company that has achieved a significant milestone with its eponymous mobile app, which has garnered over 500 million downloads worldwide. This has positioned it as the top-grossing app in the Education category on both the Apple App Store and Google Play. The company provides courses in 40 languages to approximately 75 million monthly active users (MAUs) and learners complete over 500 million language learning exercises every day on the platform.
At present, almost half of the company’s revenue originates from the United States, while the remaining half comes from abroad. The majority of its revenue originates from its English learning app, yet the company is actively diversifying into other subjects, including Duolingo Math.
Many investors believe that the language learning market is highly competitive, yet if we compare data with its main competitors, we discover that Duolingo is significantly ahead of other products. I believe that Duolingo’s primary reason for success is its robust product operation and exceptional marketing investment.
In the end, a multitude of market opinions indicate that Duolingo is priced too highly. I however believe that this question is open to debate, factoring in the company’s ability to achieve sustained high growth. If the growth rate of the next few years can be maintained at over 30%, the current valuation is either reasonable or even undervalued. I will utilize two different valuation methods later, to elaborate on my perspective of valuation.
| (USD million) | 2020 | 2021 | 2022 | 2023E |
| Total Revenue | $162 | $251 | $369 | $520 |
| Subscription Revenue | $118 | $181 | $274 | $397 |
| Non-Subscription Revenue | $44 | $70 | $96 | $123 |
| Advertising Revenue | $27 | $39 | $45 | $48 |
| DET Revenue | $15 | $25 | $33 | $39 |
| Other Revenue | $2 | $7 | $19 | $35 |
| Total Bookings | $190 | $294 | $429 | $578 |
| Total Revenue as a % of Bookings | 85% | 85% | 86% | 90% |
Source: Author’s compilations
Duolingo’s revenue is primarily comprised of subscription revenue (contributing 76%) and other revenue. The other revenue refers to advertising revenue, DET exam revenue, and revenue from the sale of value-added items such as gems.
Since some users will choose to recharge annual fees and other inter-temporal consumption, the company’s revenue will lag behind booking, which is about 90%.
| Year-on-Year Growth(%) | 2020 | 2021 | 2022 | 2023E |
| Total Revenue | 129% | 55% | 47% | 41% |
| Subscription Revenue | 114% | 54% | 51% | 45% |
| Non-Subscription Revenue | 178% | 59% | 37% | 28% |
| Advertising Revenue | 92% | 42% | 16% | 8% |
| DET Revenue | 1383% | 63% | 32% | 19% |
| Other Revenue | 159% | 247% | 168% | 89% |
Source: Author’s compilations
The company’s revenue growth rate has exceeded 40% for three consecutive years. Subscription revenue, which accounts for the largest proportion, has performed strongly, and other revenue driven by prop consumption is also growing rapidly. Advertisement revenue growth for the company is weak due to subdued macro factors, while DET exam revenue is currently digesting a high base during COVID-19.
The business model of Duolingo is to acquire users first, and users will recharge members, watch advertisements or purchase props to obtain more functions during the use process, so we can think that the core indicators of the company’s business are users and payment rates.
As a result, we can focus more on its users and subscription revenue, and other revenues will slowly follow.
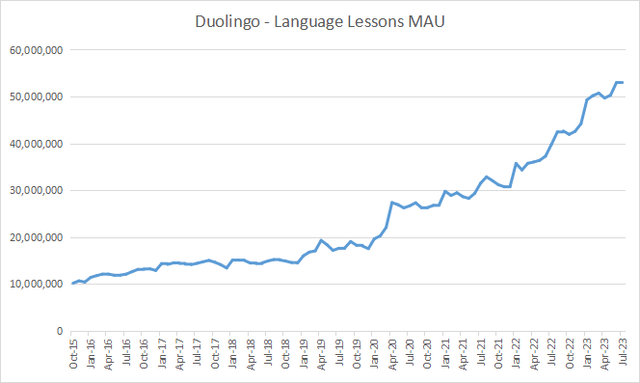
sensor tower
We can observe that Duolingo’s MAU is experiencing a rapid increase; however, the rate of growth may vary depending on the rhythm of marketing activities.
| (Millions) | Q1 ’22 | Q2 ’22 | Q3 ’22 | Q4 ’22 | Q1 ’23 | Q2 ’23 |
| Monthly Active Users (average) | 49.2 | 49.5 | 56.5 | 60.7 | 72.6 | 74.1 |
| YoY Growth | 24% | 31% | 35% | 43% | 48% | 50% |
| Paid Subscribers (end of period) | 2.9 | 3.3 | 3.7 | 4.2 | 4.8 | 5.20 |
| as % of Avg. LTM MAUs | 6.8% | 7.2% | 7.5% | 7.8% | 8.0% | 7.9% |
Source: Author’s compilations
The MAU disclosed in the financial report will be higher than the third-party data, because the third-party data misses some of the company’s apps. Anyway, their growth trends are roughly similar.
In the last two quarters, Duolingo’s MAU growth is still accelerating, and its payment rate is also steadily increasing (due to the impact of the denominator’s rapid growth, there will be some fluctuations between quarters).
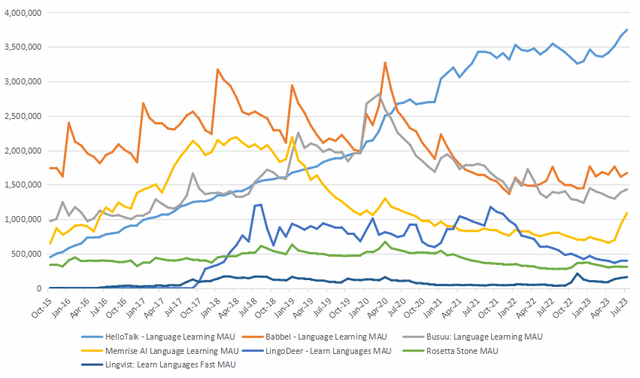
sensor tower
In the digital language learning market, the main active competitors include Duolingo, Babbel, Busuu, Memrise, HelloTalk, Rosetta Stone, Lingvist, etc. From the perspective of user stock, Duolingo is far ahead, with MAU more than 10 times that of other products. The MAU of Duolingo is above 7000w, while the MAU of most companies is below 500w. From the perspective of user growth, hellotalk and Memrise are still relatively strong. The former focuses on social networking, while the latter introduces chatbots. In fact, many products have dialogue robots, but some of them are not easy to use.
The Mau of bussu, babbel, and Rosetta all reached their peak in mid-2020 after COVID-19, mainly because the epidemic catalyzed everyone’s demand for language learning; while Duolingo’s data continued to rise. I think the reason why Duolingo can achieve a greater advantage is mainly because their excellent management is very good at marketing and product operations.
First, we’ll talk about Duolingo’s product capabilities
Unlike most traditional courses, the feature of Duolingo is gamification, which is more inclined to the learning of vocabulary and phrases. Duolingo places a lot of emphasis on user feedback, not on our own intuition. When they want to make changes to the product, they do thousands of A/B tests. The product is gradually iterated based on user feedback, and the details are gradually optimized, becoming the final version we have seen so far.
After that, I will talk about the marketing of Duolingo
The company has launched many successful marketing campaigns on social media following popular trends. They create content that delights and engages their audiences, prompting them to share it on social media.
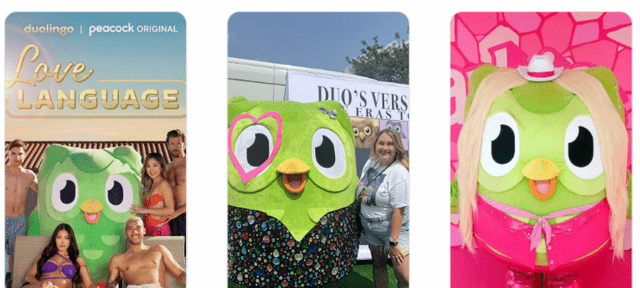
Duolingo
The rapidly growing user data of Duolingo has proved its strong marketing capabilities. Secondly, we can also observe it from the perspectives of user activity and marketing expense ratio.
Duolingo Quarterly Financial Statements
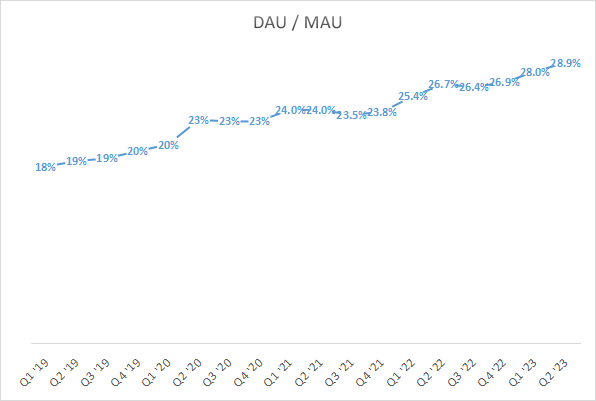
Duolingo’s user activity continues to increase.
Duolingo
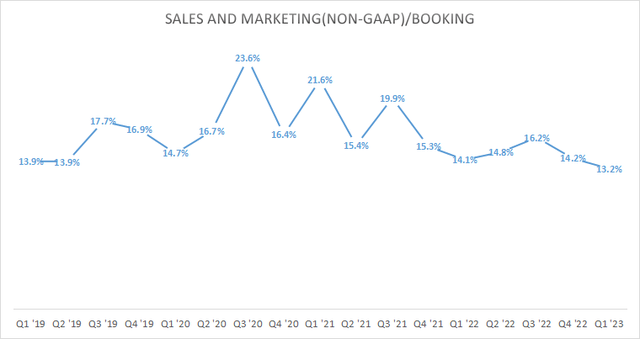
The marketing efficiency of Duolingo has also continued to improve, and has not changed due to the rapid growth of users.
Valuation
Since Duolingo is in a stage of rapid growth and rapid increase in profit margins, if we use static data to value the company, there will be large deviations. I personally prefer to use the SaaS company valuation method to value DUOL.
My first valuation method comes from the rule of 40, which is a way to measure the valuation of SaaS companies. We add the company’s growth rate to the EBITDA Margin, and then multiply by 5 times, as a reasonable valuation of the company. This method can well measure the contradiction between the growth rate and profit margin of SaaS companies. If we only use P/S to value the company, many companies will invest a lot of sales expenses to increase user growth, which is unfair.
|
(USD millions) |
Q1 ’22 |
Q2 ’22 |
Q3 ’22 |
Q4 ’22 |
Q1 ’23 |
Q2 ’23 |
|
ADJ. EBITDA |
$4 |
$4 |
$2 |
$5 |
$15 |
$21 |
|
EBITDA Margin |
4.9% |
4.7% |
2.2% |
5.0% |
13.1% |
16.5% |
Duolingo’s EBITDA Margin exceeded expectations and continued to increase month-on-month. The management’s forward guidance is 30~35%. Assuming that the EBITDA Margin reaches 20% by the end of the year, and the growth rate remains at 35%, it corresponds to 55/5 = 11 times P/S.
| Q3 ’22 | Q4 ’22 | Q1 ’23 | Q2 ’23 | |
| Total Bookings (USD Million) | 103 | 126 | 140 | 138 |
| YoY Growth | 41% | 39% | 37% | 41% |
| MAU (average) (Million) | 56.5 | 60.7 | 72.6 | 74.1 |
| YoY Growth | 35% | 43% | 48% | 50% |
According to the above discussion of Duolingo’s business model, the company’s MAU growth is a forward-looking indicator of booking. In the last two quarters, the MAU growth of Duolingo has also accelerated, with the growth rate approaching 50% for two consecutive quarters. Based on this, I assume that the booking growth rate in 2024 is 35%.
| DUOL (USD Million) | 2020 | 2021 | 2022 | 2023E | 2024E |
| Total Revenue | 162 | 251 | 369 | 520 | 705 |
| Total Bookings (A) | 190 | 294 | 429 | 580 | 783 |
| YoY Growth (B) | 55% | 46% | 35% | 35% | |
| Adj EBITDA Margin (C) | 2% | 0% | 4% | 17% | 25% |
| P/S=(B+C)*100/5 | 10.5 | 12.0 | |||
| Valuation=A*P/S | 6,068 | 9,396 |
And the annual booking in 2023 will be 580 million, which corresponds to a valuation of $6.1 billion in 2023 and $9.4 billion in 2024.
Test whether our valuation method works
|
Adobe (ADBE) (USD Million) |
2020 |
2021 |
2022 |
2023E |
2024E |
|
Total Revenue(Consensus) (A) |
12,868 |
15,785 |
17,606 |
19,387 |
22,030 |
|
YoY Growth (B) |
15% |
23% |
12% |
10% |
14% |
|
Adj EBITDA Margin (C) |
49% |
51% |
50% |
50% |
50% |
|
P/S=(B+C)*100/5 |
12.0 |
12.8 |
|||
|
Valuation=A*P/S |
232,644 |
281,984 |
|||
|
Market cap (as of Aug, 30, 2023) |
248,100 |
Adobe’s market capitalization is very close to our calculated value and is between the calculated value in 2023 and 2024.
|
Trade Desk Inc (TTD) (USD Million) |
2020 |
2021 |
2022 |
2023E |
2024E |
|
Total Revenue (Consensus) (A) |
836 |
1,197 |
1,578 |
1,955 |
2,473 |
|
YoY Growth (B) |
43% |
32% |
24% |
26% |
|
|
Adj EBITDA Margin (C) |
34% |
42% |
42% |
40% |
41% |
|
P/S=(B+C)*100/5 |
12.7 |
13.5 |
|||
|
Valuation=A*P/S |
24,785 |
33,428 |
|||
|
Market cap (as of Aug, 30, 2023) |
38,628 |
When we turn to Trade Desk Inc, we find that its current market capitalization is higher than our calculated valuation in 2024.
To sum up, our valuation method (rule of 40) is valid, and we calculate that the reasonable valuation of Duolingo should be $6.1 billion in 2023 and $9.4 billion in 2024. The latest market value is $6 billion, which is in a reasonably low range (I first submitted the article on August 24, 2023, and it has increased by 10% in the past few days).
My second valuation method uses the company’s booking multiplied by the forward net profit margin, and then multiplied by the P/E multiple.
|
DUOL (USD million) |
2020 |
2021 |
2022 |
2023 |
2024 |
|
Total Bookings (A) |
$190 |
$294 |
$429 |
$600 |
$810 |
|
yoy |
116% |
55% |
46% |
40% |
35% |
|
long-term net income margin (B) |
26% |
26% |
|||
|
Net Income (C=A*B) |
$156 |
$211 |
|||
|
P/E (D) |
40 |
35 |
|||
|
Valuation (F=C*D) |
$6240 |
$7385 |
The company’s long-term guidance for EBITDA Margin is 30~35%, and we assume that 30% can be achieved. Assuming a net margin of 85% of EBITDA, we can get a net margin close to 26%.
We can see that our valuation range is $6.24 billion to $7.39 billion.
Duolingo
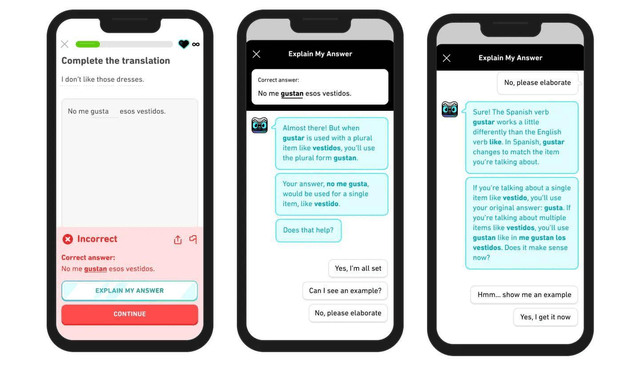
Duolingo announced in March the Duolingo Max subscription service, which incorporates OpenAI’s newly released GPT-4 large-scale language model. The Max subscription, which costs $30 per month or $168 annually, adds two new features, Explain My Answer and Roleplay, to its Super subscription. Although the project is still in the early stage and has not generated a lot of income, we believe that this will become a point where the company exceeds expectations in the future.
Given there are 1.8 billion language learners globally and 80% of Duolingo users in the US were not already learning a language when they began using Duolingo, the potential for long-term users is substantially larger than the company’s user base. If the company were to see better organic acquisition levels or more favorable returns on external marketing spend than I expect, our financial estimates for Duolingo could prove conservative.
Key risk
Admittedly, our valuation of Duolingo is based on its continued strong growth. If it has difficulty growing its user base, or its marketing efficiency has declined, our assumptions will be wrong.
Summary
During the present macro-economic climate, Duolingo stands out as a remarkable enterprise with a growth rate of approximately 40% and a notable improvement in profitability. According to the company, the language learning market is valued at up to 61 billion U.S. dollars, yet only 20% of it is online. However, Duolingo’s current revenue is only approximately $500 million, and its market value is nearly $6 billion. In the long run, Duolingo still has a significant potential for growth in untapped markets such as India and other fast-expanding regions that have not yet been fully monetized.
The era of AI has arrived, and numerous professionals believe that AI will bring significant transformations to the field of education. I believe that Duolingo’s team is undoubtedly stronger than other players, and will undoubtedly make a significant impact in this field.
In terms of investment advice, I suggest that we should stick to our positions at around $6 billion at present, and consider increasing positions if there is a decline. If the market cap exceeds $9 billion in the short term, I will become more conservative.
Read the full article here