Introduction
Recently, I have seen a lot of push to invest in Schwab US Dividend ETF (ARCX: SCHD). Frankly, I have never understood the fascination. While it is a good fund for what it does, I feel there are better opportunities elsewhere. For example, I recently wrote a piece where I felt that Global X S&P Quality Dividend ETF (ARCX: QDIV) was a far better option than SCHD.
Now I have come across another option that I feel is better than SCHD. It is the PACER US Cash Cows 100 ETF (BATS: COWZ). I will spend the rest of my time here outlining why COWZ is better than SCHD. Hint: It is all about the performance of the underlying index.
Before we start, here is some key data about SCHD and COWZ, and how they compare to SPDR S&P 500 Trust (ARCX: SPY):
|
Months (January 2017-January 2024) |
Schwab Str: US Div Eq ETF (ARCX: SCHD) |
Pacer US Cash Cows 100 (BATS: COWZ) |
SPDR S&P 500 ETF (ARCX: SPY) |
|
Average Total Return |
13.28% (±17.36%) |
15.55% (±22.16%) |
15.05% (±18.03%) |
|
Sharpe Ratio |
0.63 |
0.60 |
0.70 |
|
Sortino Ratio |
0.93 |
0.77 |
1.00 |
|
Return/Risk |
0.77 |
0.70 |
0.84 |
|
Method |
Standard Long |
Quant Model |
Standard Long |
|
Style |
Equity Income |
General |
General |
|
Size |
Large Cap |
Large Cap |
Large Cap |
|
Yield |
3.45% |
1.93% |
1.45% |
|
Beta |
0.81 |
0.94 |
1.00 |
|
Morningstar Rating |
5-Stars |
5-Stars |
4-Stars |
|
Lipper Leaders Rating |
5-Stars |
5-Stars |
5-Stars |
|
Seeking Alpha Analysts Rating |
BUY |
HOLD |
HOLD |
COWZ has a shorter historical period, so not enough annual data exists to analyze it the way I am accustomed. Despite that, it does appear that COWZ has been a better performer over the past seven years. The risk metrics, though, might give one pause before they include it in their portfolio. I will address that when I talk about the underlying indices.
The Indices
SCHD uses the Dow Jones Dividend 100 Index as its underlying methodology. Here are the criteria:
- Only companies that have paid a dividend in the last ten years qualify.
- It selects the top 100 companies based on the indicated annual dividend yield.
- It will not include REITs
- Ensures the liquidity of the security.
- Weights of the companies based on dividend yield.
- It rebalances annually in March and applies daily capping when needed.
COWZ uses the Pacer Cash Cows 100 Index and uses a separate set of criteria:
- Excluding financials, it limits its universe to the Russell 1000. It will include REITs.
- It screens companies based on their average consensus forward-year free cash flows and earnings estimates, excluding those with negative values.
- It ranks companies by their free cash flow yield.
- It selects the top 100 companies based on free cash flow yield.
- It weights companies by their free cash flow.
- It rebalances quarterly.
If one is interested in shadowing the methodology of COWZ, here are its top ten holdings:
- AbbVie Inc. (XNYS: ABBV)
- Booking Holdings Inc. (XNAS: BKNG)
- Qualcomm Incorporated (XNAS: QCOM)
- Lennar Corporation (XNYS: LEN)
- Valero Energy Corporation (XNYS: VLO)
- Marathon Petroleum Corporation (XNYS: MPC)
- Phillips 66 (XNYS: PSX)
- CVS Health Corporation (XNYS: CVS)
- D.R. Horton, Inc. (XNYS: DHI)
- Nucor Corporation (XNYS:NUE)
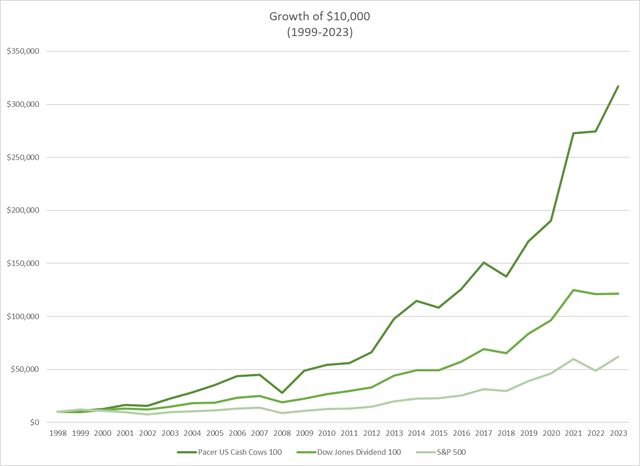
Morningstar provides us with backtested data to see how the two underlying indices would have performed against the S&P 500:

Cash Cow, DJ Dividend, and S&P 500 Comparison (Author Generated)
|
Statistics |
Years (1999-2023) |
DJ US Dividend 100 Index |
Pacer US Cash Cows 100 Index |
S&P 500 Index |
|
Average Total Return |
25 |
10.50% (±13.31%) |
14.82% (±21.17%) |
7.56% (±19.77%) |
|
Up Markets |
19 |
14.95% |
21.18% |
17.11% |
|
Down Markets |
6 |
-2.50% |
-3.18% |
-17.83% |
|
Modified Sharpe Ratio |
0.77 |
0.79 |
0.57 |
|
|
Modified Sortino Ratio |
0.92 |
0.90 |
0.62 |
|
|
Return/Risk Ratio |
0.79 |
0.70 |
0.38 |
|
One should see that both indices outperform the broader S&P 500 index. That, in part, is what makes SCHD favored by so many. What makes the Cash Cows Index special is that it outperforms the broader market index during up and down markets. That is not a common feat and something one should not ignore. Note that the Cash Cows approach has a more volatile performance. That is due to the outsized return it had in 2009 when it yielded 72.96%.
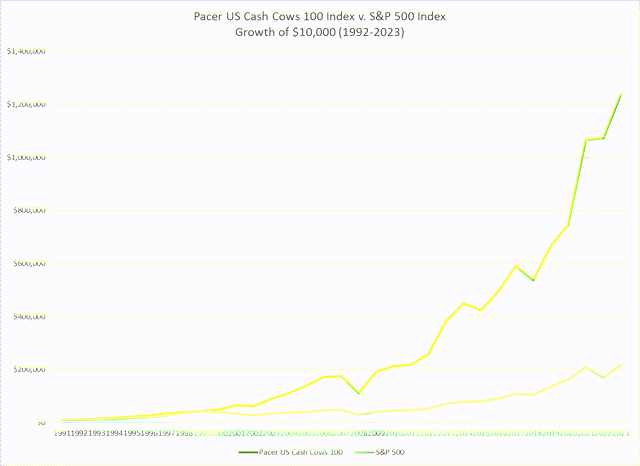
Data for the Cash Cows Index dates earlier to 1992. For 1992-2023, the results are sobering for those who insist on investing solely in the S&P 500.

Cash Cows and S&P 500 Comparison (Authored Generated)
|
Statistics |
Years (1992-2023) |
Pacer US Cash Cows 100 Index |
S&P 500 Index |
|
Average Total Return (Annual) |
32 |
16.25% (±19.25%) |
10.07% (±18.88%) |
|
Up Markets |
26 |
21.26% |
17.75% |
|
Down Markets |
6 |
-3.18% |
-17.83% |
|
Modified Sharpe Ratio |
0.76 |
0.52 |
|
|
Modified Sortino Ratio |
0.93 |
0.83 |
|
|
Return/Risk Ratio |
0.84 |
0.53 |
|
Again, the consistency in the outperformance is affirmed. The Cash Cows Index outpaces the S&P 500 during up and down markets. The risk ratios also show that one is not taking unnecessary risks to tap into this style of investing.
It becomes important to add, for disclosure, that one cannot invest in an index directly. Investing in an ETF is not investing directly in an index, but only in a facsimile of the index. Despite that, it is important to show how much is the tracking divergence when one compares an ETF with its underlying index. SPY has outperformed the S&P 500 by 0.11% (±0.09%) per year. SCHD has underperformed its underlying index by -0.53% (±1.48%). Meanwhile, COWZ has exceeded its index’s return by 0.66% (±0.61%).
A Recent Piece About SCHD and COWZ
I recently read an excellent piece from John Bowman where he outlines his thesis on why Schwab US Dividend Equity ETF (ARCX: SCHD) is better than Pacer US Cash Cows 100 ETF (BATS: COWZ). Mr. Bowman’s thesis is clear and organized but leaves out a key analysis of the underlying indices for each ETF.
The thesis of Bowman’s article outlines the following reasons for his belief that SCHD is a better option (barely) than COWZ:
- SCHD pays a better dividend yield. SCHD yields 3.49% v. COWZ dividend yield of 1.93%
- COWZ is positioned better when it comes to factor exposure because it is more varied.
- SCHD has a more rigorous methodology than COWZ, thus Bowman prefers SCHD.
- COWZ has less stock risk than SCHD, giving it a higher preference for Bowman.
- Based on data from Seeking Alpha, SCHD has a better quant rating than COWZ.
Mr. Bowman’s analysis is deep and far-ranging and is to be admired. I showed, however, that he is missing one key element in his analysis, and that is underlying index performance. I believe that if one were to look at the underlying indices, one would see that COWZ is a far better option for building wealth. In the end, it was, is, and always will be about performance.
My Take
We have entered a period where we can access over 25 years’ worth of data to see how specialty indices have performed. The technology, research, and backtesting allow us to give proper analysis to see if a particular strategy works. I have studied ETFs and their construction to see if certain methods help an investor achieve market-beating returns. With this exercise, we have strong data to show that focusing on free cash flow is important.
Mr. Bowman believes that SCHD is a better option than COWZ. His point system gives SCHD a slight edge. In my humble opinion, the facts about total returns for the underlying indices make the conclusion pretty obvious. COWZ is a better ETF than SCHD.
Have fun and keep investing.
Read the full article here


