Earnings of BOK Financial Corporation (NASDAQ:BOKF) will most probably surge this year on the back of mid-single-digit loan growth. I’m expecting the company to report earnings of $9.00 per share for 2023, up 17% year-over-year. Compared to my last report on the company, I’ve slightly increased my earnings estimate. The year-end target price suggests a high upside from the current market price. Based on the total expected return and considering the risk level, I’m maintaining a hold rating on BOK Financial stock.
Mid-Single-Digit Loan Growth to Drive Earnings
The management mentioned in the earnings presentation that it is expecting mid-to-upper-single-digit loan growth for 2023, which is quite ambitious considering BOK Financial was able to achieve loan growth of just 0.8% in the first quarter, or 3.2% annualized. Further, the current high-rate environment is not conducive to loan growth.
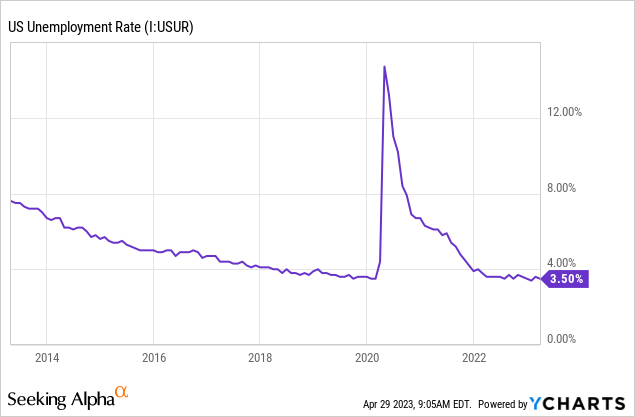
On the other hand, decent-sized pipelines and the growth momentum will support loan growth in the year ahead, according to details given in the earnings presentation. Further, strong labor markets indicate robust business activity, which, in turn, bodes well for loan growth. BOK Financial operates in several states across the Midwest and Southwest. Therefore, the national average is an appropriate proxy for BOK Financial’s markets. The Federal Reserve is projecting the unemployment rate to rise to 4.5% this year, which is quite low when compared to previous years.

In my opinion, the loan growth for 2023 will likely be at the lower end of management’s guidance. I’m expecting a loan growth of 5% for 2023. The following table shows my balance sheet estimates.
| Financial Position | FY18 | FY19 | FY20 | FY21 | FY22 | FY23E |
| Net Loans | 21,449 | 21,540 | 22,619 | 19,949 | 22,321 | 23,528 |
| Growth of Net Loans | 26.7% | 0.4% | 5.0% | (11.8)% | 11.9% | 5.4% |
| Other Earning Assets | 12,348 | 15,451 | 18,924 | 24,950 | 19,601 | 17,941 |
| Deposits | 25,264 | 27,621 | 36,144 | 41,242 | 34,481 | 33,568 |
| Borrowings and Sub-Debt | 7,419 | 8,621 | 3,821 | 2,494 | 7,138 | 6,663 |
| Common equity | 4,432 | 4,856 | 5,266 | 5,364 | 4,683 | 5,203 |
| Book Value Per Share ($) | 66.5 | 68.2 | 75.8 | 78.2 | 69.7 | 78.4 |
| Tangible BVPS ($) | 48.7 | 51.7 | 59.1 | 61.6 | 53.0 | 61.6 |
| Source: SEC Filings, Author’s Estimates (In USD million unless otherwise specified) | ||||||
The Margin is Likely to Remain Stable for the Remainder of the Year
After growing strongly in the last nine months of 2022, the margin shrank in the first quarter of 2023. This change came as a surprise to me as I had anticipated the margin to remain unchanged. The dip was attributable to both (i) the migration of deposits away from non-interest-bearing deposits and (ii) a hike in the overall deposit beta (rate sensitivity).
Going forward, the large balance of variable-rate loans will sustain the margin as interest rates will rise till the middle of this year. I’m expecting the fed funds rate to increase by 25-50 basis points before the end of June. Variable-rate loans and fixed-rate loans that will re-price within one year made up a hefty 73% of the total loan portfolio, as mentioned in the earnings presentation.
However, the large securities portfolio will limit the margin’s expansion. The estimated effective duration of the portfolio is 3.6 years; therefore, only a small part of the portfolio can be expected to re-price this year. Further, the higher deposit beta will restrict the margin’s growth.
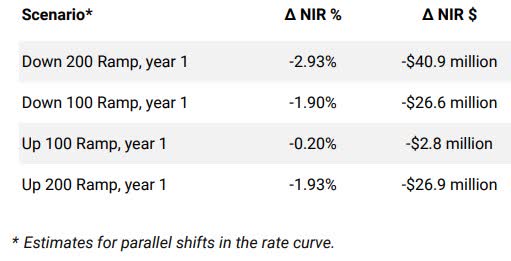
According to the results of the management’s rate-sensitivity simulation model, a 200-basis points hike in rates could decrease the net interest income by 1.93% over twelve months.
1Q 2023 Earnings Presentation
Overall, I’m expecting the margin to remain unchanged in the last nine months of 2023 from the first quarter’s level.
Doubling the Provisions Estimate and Raising the Earnings Estimate
The reported provision expense was almost double my estimate for the first quarter of 2023. The management mentioned in the earnings presentation that it intends to maintain a strong reserve level. Further, it expects the quarterly provision level for the year ahead to be similar to the first quarter’s level. As a result, I’ve revised upwards my estimate for provisions for loan losses.
My loan balance estimate is also higher than before because the fourth quarter’s loan growth beat my expectations. I’m now expecting BOK Financial to report earnings of $9.00 per share for 2023, which is slightly higher than my previous estimate of $8.90 per share. The following table shows my updated earnings estimate.
| Income Statement | FY18 | FY19 | FY20 | FY21 | FY22 | FY23E |
| Net interest income | 985 | 1,113 | 1,108 | 1,118 | 1,211 | 1,409 |
| Provision for loan losses | 8 | 44 | 223 | (100) | 30 | 64 |
| Non-interest income | 617 | 694 | 844 | 756 | 643 | 687 |
| Non-interest expense | 1,028 | 1,132 | 1,166 | 1,178 | 1,164 | 1,260 |
| Net income – Common Sh. | 446 | 501 | 432 | 614 | 516 | 597 |
| EPS – Diluted ($) | 6.63 | 7.03 | 6.19 | 8.95 | 7.68 | 9.00 |
| Source: SEC Filings, Author’s Estimates (In USD million unless otherwise specified) | ||||||
Risk Level Appears Manageable
As of the end of March 2023, the uninsured and uncollateralized deposits amounted to $14.2 billion and made up a sizable 44% of total deposits. However, I’m not worried because even in the event of a deposit run à la SVB Financial (OTC:SIVBQ) and First Republic Bank (FRC), BOKF will not feel compelled to sell its securities portfolio and recognize the as-yet-unrealized mark-to-market losses. This is because BOKF has available liquidity (including fed funds capacity and Federal Reserve discount window) that is 167% of the uninsured and uncollateralized deposits.
The unrealized losses on the Available-for-Sale (“AFS”) securities portfolio dipped to $742 million by the end of March 2023 from $866 million at the end of December 2022. Following the dip, these unrealized losses are now as large as around 15% of total equity. Worse comes to worst and BOK Financial feels compelled to sell its AFS portfolio at a loss, then the losses will reduce the common equity tier I, CET1, ratio to 9.95% from 12.2% at the end of March, as mentioned in the presentation. This CET1 ratio in the worst-case scenario will still be above the minimum regulatory requirement of 7.0%.
As a result, an extreme stress situation is unlikely to raze BOKF to the ground. However, stressful situations can still have a bearing on earnings. In case of a deposit run, BOKF may have to replace cheap deposits with higher-costing funds, which could hurt the margin. Additionally, BOKF may of its own volition sell some of its AFS securities and realize some of the unrealized losses, in order to better utilize the funds. In such a case, the bottom line will take an immediate hit but benefit in the longer run. Overall, I think the risk level is manageable.
Maintaining a Hold Rating
BOK Financial is offering a dividend yield of 2.6% at the current quarterly dividend rate of $0.54 per share. The earnings and dividend estimates suggest a payout ratio of 24% for 2023, which is close to the five-year average of 28%. Therefore, I’m not expecting an increase in the dividend level.
I’m using the historical price-to-tangible book (“P/TB”) and price-to-earnings (“P/E”) multiples to value BOK Financial. The stock has traded at an average P/TB ratio of 1.46 in the past, as shown below.
| FY19 | FY20 | FY21 | FY22 | Average | ||
| T. Book Value per Share ($) | 52.1 | 59.1 | 61.6 | 53.0 | ||
| Average Market Price ($) | 81.2 | 60.2 | 90.6 | 93.8 | ||
| Historical P/TB | 1.56x | 1.02x | 1.47x | 1.77x | 1.46x | |
| Source: Company Financials, Yahoo Finance, Author’s Estimates | ||||||
Multiplying the average P/TB multiple with the forecast tangible book value per share of $61.6 gives a target price of $89.6 for the end of 2023. This price target implies a 6.9% upside from the April 28 closing price. The following table shows the sensitivity of the target price to the P/TB ratio.
| P/TB Multiple | 1.26x | 1.36x | 1.46x | 1.56x | 1.66x |
| TBVPS – Dec 2023 ($) | 61.6 | 61.6 | 61.6 | 61.6 | 61.6 |
| Target Price ($) | 77.3 | 83.5 | 89.6 | 95.8 | 101.9 |
| Market Price ($) | 83.9 | 83.9 | 83.9 | 83.9 | 83.9 |
| Upside/(Downside) | (7.8)% | (0.5)% | 6.9% | 14.2% | 21.6% |
| Source: Author’s Estimates |
The stock has traded at an average P/E ratio of around 10.9x in the past, as shown below.
| FY19 | FY20 | FY21 | FY22 | Average | ||
| Earnings per Share ($) | 7.03 | 6.19 | 8.95 | 7.68 | ||
| Average Market Price ($) | 81.2 | 60.2 | 90.6 | 93.8 | ||
| Historical P/E | 11.5x | 9.7x | 10.1x | 12.2x | 10.9x | |
| Source: Company Financials, Yahoo Finance, Author’s Estimates | ||||||
Multiplying the average P/E multiple with the forecast earnings per share of $9.0 gives a target price of $98.2 for the end of 2023. This price target implies a 17.0% upside from the April 28 closing price. The following table shows the sensitivity of the target price to the P/E ratio.
| P/E Multiple | 8.9x | 9.9x | 10.9x | 11.9x | 12.9x |
| EPS 2023 ($) | 9.00 | 9.00 | 9.00 | 9.00 | 9.00 |
| Target Price ($) | 80.2 | 89.2 | 98.2 | 107.2 | 116.2 |
| Market Price ($) | 83.9 | 83.9 | 83.9 | 83.9 | 83.9 |
| Upside/(Downside) | (4.4)% | 6.3% | 17.0% | 27.8% | 38.5% |
| Source: Author’s Estimates |
Equally weighting the target prices from the two valuation methods gives a combined target price of $93.9, which implies an 11.9% upside from the current market price. Adding the forward dividend yield gives a total expected return of 14.5%.
Under normal circumstances, I would adopt a buy rating if the total expected return was in double digits. However, given the current negative sentiment in the entire banking sector and fears of a deposit run, I’ve decided to maintain a hold rating on BOK Financial.
Read the full article here


