
Introduction
BancFirst Corporation (NASDAQ:BANF) is a financial holding company headquartered in Oklahoma City, and operates a number of subsidiary banks, where the vast majority of its business is done through its wholly owned subsidiary BancFirst. The vast majority of its presence is in Oklahoma – in 2022, its market share of deposits within the state of Oklahoma was 7.19%.
BancFirst Corporation currently has 106 banking locations in 59 communities in Oklahoma, 3 banking locations in the Dallas Metroplex area, and 4 locations in Dallas-Fort Worth Metroplex area. BancFirst provides commercial banking services to retail customers, as well as small to medium sized businesses.
It acts as a “super community bank”, which means that management is decentralized to the community banking offices, which allows them to respond to local demands and needs. On the other hand, BancFirst centralizes almost all of its processing, support, and investment functions as a means to achieve operational efficiency and operational consistency.
BancFirst’s primary lending activity is business and industry financing in its geographic locales, mainly for small to medium sized businesses in light manufacturing, local wholesale and retail trade, commercial and residential real estate development and construction, services, agriculture, and energy. The consumer lending business largely consists of automobile financing, home equity loans, and personal loans, as well as residential loans for home in areas outside of large metropolitan areas.
Deposit services include checking accounts, Negotiable Order of Withdrawal accounts, savings accounts, money market accounts, sweep accounts, individual retirement accounts, and certificates of deposit.
In this article, I will take a very data and numbers-driven approach to evaluate BancFirst.
Examining Assets & Liabilities
Below I will present the 6 balance sheet items that are of the most interest, in a time series from 2009 to present. The other assets and liabilities not displayed here are not of significant magnitude or interest. This following chart and the associated graphs will allow us to see the growth of BancFirst over the years since the Great Financial Crisis, and also pass some judgments about management’s decision making.
All figures are in millions. All figures were extracted from the 2010, 2012, 2014, 2016, 2018, 2020, 2022 10-K filings, as well as the Q1 2023 10-K filing.
| Interest Bearing Deposits With Banks | Debt Securities Available For Sale | Loans, Net Of Allowance For Credit Losses | Goodwill | Non-Interest-Bearing Deposits | Interest-Bearing Deposits | |
| 2009 | 930 | 417 | 2,702 | 35 | 1,158 | 2,771 |
| 2010 | 1,111 | 746 | 2,776 | 45 | 1,318 | 3,185 |
| 2011 | 1,544 | 615 | 3,013 | 45 | 1,705 | 3,333 |
| 2012 | 1,732 | 563 | 3,242 | 45 | 2,017 | 3,424 |
| 2013 | 1,661 | 528 | 3,348 | 45 | 2,086 | 3,334 |
| 2014 | 1,710 | 525 | 3,820 | 45 | 2,411 | 3,494 |
| 2015 | 1,395 | 553 | 4,190 | 54 | 2,410 | 3,564 |
| 2016 | 1,667 | 470 | 4,352 | 54 | 2,527 | 3,721 |
| 2017 | 1,542 | 462 | 4,620 | 54 | 2,550 | 3,865 |
| 2018 | 1,196 | 771 | 4,925 | 80 | 2,614 | 3,992 |
| 2019 | 1,646 | 490 | 5,608 | 149 | 2,956 | 4,527 |
| 2020 | 1,336 | 552 | 6,303 | 150 | 3,791 | 4,274 |
| 2021 | 1,821 | 532 | 6,086 | 150 | 3,775 | 4,317 |
| 2022 | 2,910 | 1,538 | 6,851 | 182 | 4,945 | 6,029 |
| 2023 Q1 | 2,624 | 1,616 | 7,024 | 182 | 4,540 | 6,070 |
Banks grow and breathe on loan and deposit growth, because banking profits come from the net interest margin difference between rates earned on loans and rates paid on deposits. I did a quick logarithmic regression to see the rate at which loans and deposits have grown – for both, it’s roughly 7%/year. This means that all else growing at the same pace, earnings also grew at 7%/year too – from 2009 to 2022, net income grew from $2.13/share to $5.89/share.
The column most salient to headlines in the recent news is the “Debt Securities Available For Sale”. Here is the first piece of good news: if we remember the recent history of interest rates, we would know that 2009 – 2021 was a period of zero lower bound interest rates, punctuated by a slight hike in 2018-2020. BancFirst dutifully avoided investing in treasury securities during these years. This therefore allowed BancFirst to mitigate the issue of unrealized losses in their securities portfolio.
After the effects of the COVID stimulus hit in full force where inflation spiked and triggered the ongoing series of interest rate hikes, management increased the balance of marketable securities by a whole billion dollars. No doubt, this was meant to take advantage of the rising interest rate environment to capture the risk-free return of treasury bills. This is excellent timing.
Additionally, we can also see that in general, the loan balance was roughly equal to the interest-bearing deposit balance, and the deposits at banks & debt securities were roughly equal to the non-interest bearing deposits, making a rough liquidity match between assets and liabilities. One more brownie point for BancFirst.
The Goodwill column shows a trail of mergers & acquisitions. Digging through the 10-K filings shows what they were. Let’s list them out:
- Feb 8, 2022: Acquired Worthington for $77.7m in cash. $478m total assets, $257m in loans, $430m in deposits. Added $32.1m of goodwill and core deposit intangible of $5.9m.
- May 20, 2021: Assets purchased from The First National Bank and Trust Company of Vinita, Oklahoma for $21m. $284m total assets, $195m in loans, $256m of deposits and other liabilities. Bought at a $4.8m discount to fair value. Added $1.7m in core deposit intangibles.
- March 5, 2020: Assets purchased from The Citizens State Bank of Okemah, Oklahoma for $2.9m. $47.8m in total assets, $22.9m in loans, $45.0m in deposits and other liabilities. Added $1.3m of goodwill and $0.2m of core deposit intangibles.
- Aug 15, 2019: Acquired Pegasus Bank for $123.5m in cash. $651.1m in total assets, $389.9m in loans, and $603.9 in deposits. Added $68.8m in goodwill and $5.9m in core deposit intangibles.
- Aug 31, 2018: Acquired Cotter Ranch Tower, 507,000 square feet, for corporate HQ for $21m. 55% of the tower is leased as income producing, and the company occupies about 35%.
- Jan 11, 2018: Acquired First Wagoner Corp. $290m in total assets, $247m in loans, and $251m in deposits. Added $19.1m of goodwill and $6.3m of core deposit intangibles.
- Jan 11, 2018: Acquired First Chandler Corp. $88m in total assets, $66m in loans, $79m in deposits. Added $6.6m in goodwill and $2.2m in core deposit intangibles.
- Oct 8, 2015: Acquired CSB Bancshares Inc. $196m in total assets, $147m in loans, $175m in deposits and $22m in equity capital. Added $9.4m of goodwill and $7.1m of core deposit intangibles.
- Jan 24, 2014: Acquired The Bank of Union, El Reno, Oklahoma. $121m in loans, $4.8m of securities, $302m in total deposits. Added $0.4m in goodwill and $2.2m in core deposit intangibles.
- July 12, 2011: Acquired FBC Financial Corporation. $217m in total assets, $116m in loans, $178m in deposits, $18m equity capital.
- Dec 15, 2010: Acquired OK Bancorporation, Inc. $73m total assets, $32m in loans, $62m in deposits, $9m equity capital.
- Dec 10, 2010: Acquired Exchange Bancshares of Moore, Inc. $147m in total assets, $47m in loans, $116m in deposits, $10m in equity capital.
- Oct 8, 2010: Acquired Union National Bancshares, Inc. $134m in total assets, $90m in loans, $117m in deposits, $15m in equity capital.
Summing the summary data across all of these transactions, I get a total of $1,614.8m in total loans acquired, and $2,553.9m in total deposits acquired. During the period 2010 – present, BancFirst increased its loans by a total of $4,322m and its total deposits by $6,681m.
Acquisitions play a very important role in BancFirst’s growth strategy, and can be considered a key part of BancFirst’s business plans.
Examining The Income Statements
Below I will present 4 summarizing pieces of income statement figures across a time series from 2008 to 2022. The net interest margin was reported on past 10-K’s, while I did the estimate computation for the efficiency ratio. Figures are in millions, except for the ratios, which are in percents.
| Net Interest Income After Provision For Loan Losses | Noninterest Income | Noninterest Expense | Net Income | Efficiency Ratio (%) | Net Interest Margin (%) | |
| 2006 | 142 | 58 | 125 | 52 | 62.50 | 4.75 |
| 2007 | 145 | 71 | 134 | 59 | 62.04 | 4.63 |
| 2008 | 128 | 74 | 135 | 52 | 66.83 | 4.05 |
| 2009 | 121 | 67 | 139 | 29 | 73.94 | 3.42 |
| 2010 | 140 | 70 | 144 | 40 | 68.57 | 3.37 |
| 2011 | 152 | 77 | 159 | 46 | 69.43 | 3.20 |
| 2012 | 162 | 88 | 170 | 52 | 68.00 | 3.13 |
| 2013 | 162 | 90 | 172 | 54 | 68.25 | 3.04 |
| 2014 | 178 | 96 | 184 | 64 | 67.15 | 3.09 |
| 2015 | 181 | 106 | 186 | 66 | 64.81 | 3.12 |
| 2016 | 192 | 107 | 191 | 71 | 63.88 | 3.25 |
| 2017 | 219 | 118 | 200 | 86 | 59.35 | 3.44 |
| 2018 | 257 | 125 | 222 | 126 | 58.12 | 3.70 |
| 2019 | 274 | 137 | 241 | 135 | 58.64 | 3.85 |
| 2020 | 244 | 137 | 258 | 100 | 67.72 | 3.57 |
| 2021 | 324 | 170 | 286 | 168 | 57.89 | 3.15 |
| 2022 | 364 | 184 | 310 | 193 | 56.57 | 3.29 |
As we would expect from a bank whose assets and deposits grow at ~7%/year, the net interest income at BancFirst also grew at roughly 7%/year. Worth noting, however, is that net income grew somewhat faster than 7%/year over this period.
The next column in the table explains why. As BancFirst grew by acquisition and organically, we can see a gradual general improvement in the efficiency ratio, from the high 60s around 2010, to the mid 50s in 2022. This additionally means that BancFirst possesses economy of scale, as well as being able to properly integrate its acquired banks and businesses into its existing franchise to produce those economies of scale.
Another item that jumps out at me here is the net interest margin. BancFirst sustains a net interest margin of almost 350 basis points on average, which is a little higher than the average across the US, which is closer to 300bps.
Most notably here though is that for crisis years 2008, 2009, and 2020, net income was positive – an attractive and unusual part of a US bank’s history. Why this happened will become apparent when we examine credit quality.
Examining Credit Quality
Below are charts of three metrics of credit quality: nonperforming & restructured loans, allowance for credit losses to total loans, and net charge-offs, all expressed as a percentage of total loans. These figures were taken from past 10-K filings.
| All figures in percent | Nonperforming And Restructured Loans To Total Loans | Allowance For Credit Losses To Total Loans | Net Charge-Offs To Average Loans |
| 2006 | 0.51% | 1.19% | 0.09% |
| 2007 | 0.54% | 1.17% | 0.08% |
| 2008 | 0.86% | 1.24% | 0.21% |
| 2009 | 1.46% | 1.33% | 0.30% |
| 2010 | 1.00% | 1.27% | 0.13% |
| 2011 | 0.76% | 1.25% | 0.09% |
| 2012 | 1.20% | 1.19% | 0.07% |
| 2013 | 0.98% | 1.15% | 0.03% |
| 2014 | 0.88% | 1.06% | 0.03% |
| 2015 | 1.11% | 0.98% | 0.17% |
| 2016 | 0.80% | 1.10% | 0.10% |
| 2017 | 0.84% | 1.09% | 0.12% |
| 2018 | 0.76% | 1.03% | 0.08% |
| 2019 | 0.84% | 0.96% | 0.10% |
| 2020 | 0.78% | 1.42% | 0.35% |
| 2021 | 0.48% | 1.36% | 0.11% |
| 2022 | 0.35% | 1.33% | 0.02% |
What is comforting here is the sheer consistency and predictability of the first two metrics on a year-by-year basis. This means that a shareholder can sleep easy knowing that there are few surprises to be expected. I have bolded out the years 2008, 2009, and 2020 as important years where crisis economic conditions should lead us to expect poor credit performance – heightened levels of asset charge-off rates. Let’s compare this with aggregate data for across US banks.
Data in the next graph were accessed from FRED, the online portal for data by the Federal Reserve.
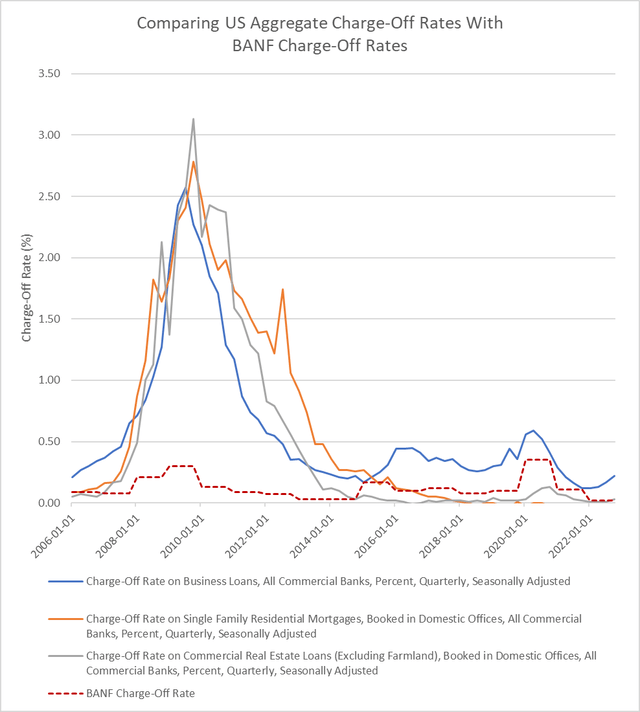
Comparison of BANF with US Aggregate Charge-Off Rates (FRED & Past 10-K Filings)
The solid grey, blue, and orange lines represent charge off rates for various types of loans as an aggregate across the US, while the dotted red line represents the overall charge-off rate for BANF. The reason why BANF generated a substantial net income in 2008, 2009, and 2020 was that its charge-off rate was drastically lower than the national aggregates.
This is a testament to the credit quality at BancFirst.
Stock Performance & Metrics
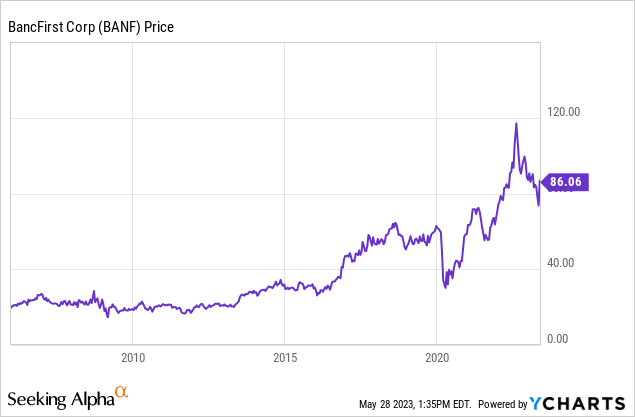
How did all this performance filter through in stock returns? As a broad trend, an exponential growth in share prices that follow the trend of net income. Notably, the price did not collapse substantially in 2008-2009.
Let’s also take a look at share count:
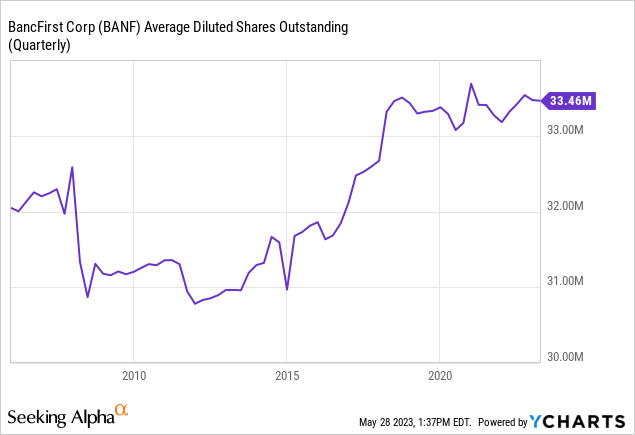
The graph would make it appear that share count exploded, but a quick inspection of the axis shows that throughout the 2006 – present time period, the share count was between 30 – 34 million. This goes to show that the acquisitions done in the past 10 years were primarily funded by cash, which is best for shareholders as it avoids share count dilution. However, investing in BancFirst comes with a caveat: the dividend income is modest.
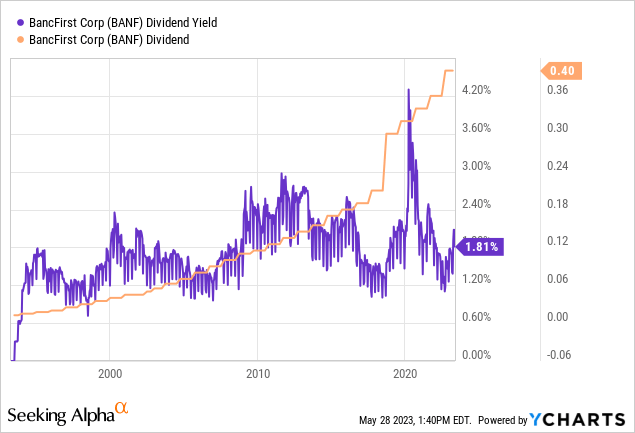
Though the outcome of all the loan, deposit, business, and net income growth is an expansive growth of the per share dividend, the dividend yield itself remains modest. This means that the majority of the returns from holding BancFirst should be expected to be from capital gains, held over the long run.
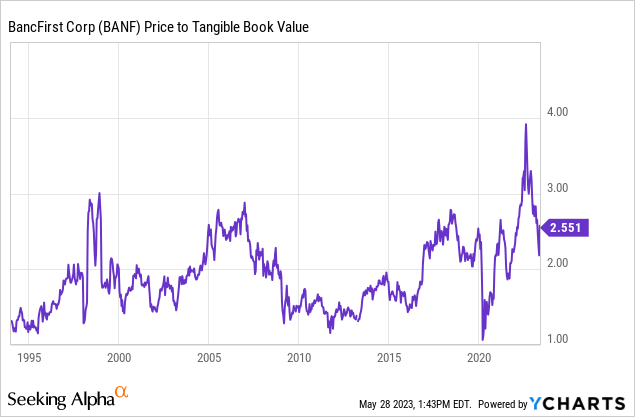
A look at the price to tangible book value chart shows that currently the bank is valued at 2.551x tangible book value. This is on the higher end of the bank’s historical valuation by the market, which is why I would rate this stock a HOLD – there may be better prices ahead. However, the long run share price chart should be encouraging: in the short run, the stock market is a popularity contest, but in the long run it is a weighing machine. And the market has weighed BancFirst and found it highly satisfactory.
Conclusions
- BancFirst uses acquisitions, mostly paid for with cash, as part of growth strategy, aside from organic growth.
- As BancFirst grew and incorporated more and more acquisitions into its fold, it gained economy of scale and gradually improved its efficiency.
- BancFirst’s credit quality is absolutely top notch, especially when measured with loan charge-off rates when observing crisis years.
- The stock is on the expensive side right now, but time will likely provide prospective buyers with better prices.
Read the full article here
