Introduction
Baker Hughes Company (NASDAQ:BKR) released its first quarter 2023 results on April 19, 2023.
Note: This article updates my March 30, 2023 article. I have followed BKR on Seeking Alpha since December 2020.
1 – First Quarter 2023 Results Snapshot
The company reported first-quarter 2023 adjusted earnings of $0.28 per share, beating analyst expectations this quarter against $0.15 last year. Total quarterly revenues of $5,716 million were above expectations, with consolidated orders of $7.632 billion.
The stronger-than-expected quarterly results were due to higher contributions from the Oilfield Services and Equipment and Industrial & Energy Technology business units.
BKR 1Q23 Financials (BKR Presentation)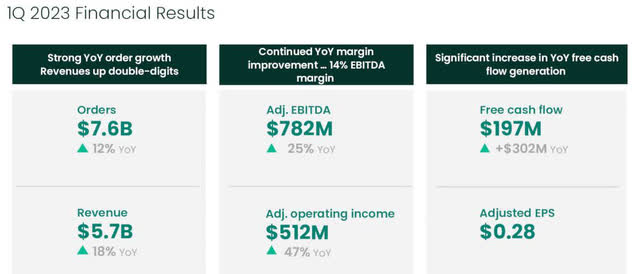
CEO Lorenzo Simonelli said in the conference call:
we maintained our strong order momentum in IET and SSPS. We also delivered solid operating results at the high-end of our guidance in both business segments, booked almost $300 million of new energy orders and generated approximately $200 million of free cash flow.
Note: I regularly cover three companies in oilfield services. Baker Hughes is my third choice after Schlumberger (SLB) and Halliburton (HAL). I strongly recommend reading my recent articles about the 1Q23 results about this article.
- You can read my article published on May 29, 2023, on Schlumberger by clicking here.
- You can read my article published on June 12, 2023, on Halliburton by clicking here.
2 – Stock Performance
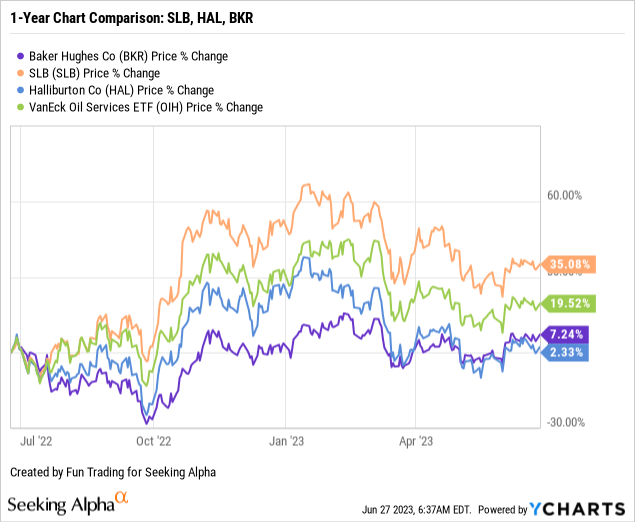
Baker Hughes and its peers have retreated since the start of 2023. BKR is up 7% on a one-year basis, underperforming its main competitor SLB, which is up 35% YoY.
3 – Baker Hughes Compared to Schlumberger and Halliburton
The oilfield services segment is a tricky sector depending indirectly on the commodity prices such as oil and gas. This sector offers some upside when the oil sector is bullish, but quickly declines on any signs of economic weakness, as we experience with China’s economy’s recent disappointment.
Comparing Baker Hughes Company to SLB and HAL balance sheets shows that BKR performs better than its peers on a free cash flow basis.
| Comparison SLB/HAL/BKR in $ million | SLB 1Q23 | HAL 1Q23 | BKR 1Q23 |
| Total Revenues | 7,736 | 5,677 | 5,716 |
| Net Income | 934 | 651 | 576 |
| EBITDA | 1841 | 1,188 | 1,093 |
| Operating Cash Flow | 330 | 122 | 461 |
| CapEx | 410 | 268 | 310 |
| Free Cash Flow | -80 | -146 | 151 |
| Total Cash | 2,504 | 1,879 | 2,415 |
| Total LT Debt | 12,838 | 7,929 | 6,659 |
| Shares outstanding (Diluted) | 1,446 | 907 | 1,018 |
| Quarterly Dividend and yield | 0.25/2.13% | 0.16/2.03% | 0.19/2.50% |
However, BKR’s dividend yield is slightly better than its peers, with a quarterly dividend of $0.19 this quarter.
BKR 1Q23 Revenues per Region comparison BKR, SLB, HAL (Fun Trading)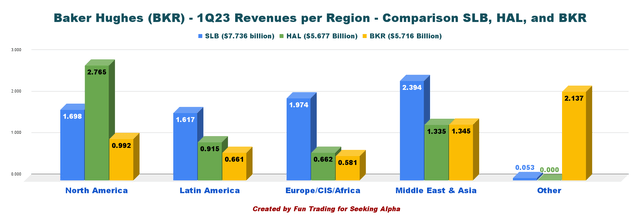
BKR has a robust presence in the Middle East and Asia. However, the chart above is slightly misleading due to the “other” revenues, representing the Turbomachinery & process solutions and Digital Solutions covering the four regions.
BKR shows strength in LNG equipment and new energy. In the conference call, CEO Lorenzo Simonelli said:
Another notable characteristic of this cycle is the continued shift towards the development of natural gas and LNG. As the world increasingly recognizes the crucial role natural gas will play in the energy transition, serving us both a transition and destination fuel, the case for a multi-decade growth opportunity in gas is steadily improving. This is driving operators of all sizes to dedicate more spending towards natural gas development as well as LNG projects and associated infrastructure… For these reasons, LNG project sanctioning activity has gotten off to a strong start in 2023 with 20 MTPA already reaching FID and other projects likely to soon follow.
Thus, BKR is a solid oilfield-services business and could be a candidate for a small long-term investment. I am glad that BKR was the only oilfield services company generating free cash flow in 1Q23 with $151 million.
Note: As I said in my preceding article, the company combined the Oilfield-Services segment with the Oilfield Equipment segment to form the OFSE component. It combined the Turbomachinery & Process Solutions segment with the Digital Solutions segment to create the IET segment.
As a standard recommendation, I suggest trading short-term LIFO for about 40% of your long-term position to take advantage of the volatility and unforeseen events expected in this industry.
Baker Hughes – The Raw Numbers – First Quarter of 2022
| Baker Hughes | 1Q22 | 2Q22 | 3Q22 | 4Q22 | 1Q23 |
| Total Orders in $ Billion | 6.84 | 5.86 | 6.06 | 8.01 | 7.63 |
| Total Revenues in $ Billion | 4.84 | 5.05 | 5.37 | 5.91 | 5.72 |
| Net Income available to common shareholders in $ Million | 72 | -839 | -17 | 182 | 576 |
| EBITDA $ Million | 528 | -321 | 463 | 664 | 1,093 |
| EPS diluted in $/share | 0.08 | -0.84 | -0.02 | 0.18 | 0.57 |
| Operating cash flow in $ Million | 72 | 321 | 597 | 898 | 461 |
| CapEx in $ Million | 268 | 226 | 226 | 269 | 310 |
| Free Cash Flow in $ Million | -196 | 95 | 371 | 629 | 151 |
| Total Cash $ Billion | 3.19 | 2.93 | 2.85 | 2.49 | 2.42 |
| Debt Consolidated in $ Billion | 6.69 | 6.66 | 6.66 | 6.66 | 6.66 |
| Dividend per share in $ | 0.18 | 0.18 | 0.18 | 0.19 | 0.19 |
| Shares Outstanding (Diluted) in Million | 948 | 1,001 | 1,008 | 999 | 1,018 |
Source: Company release.
Analysis: Earnings Details
1 – Revenues and other income were $5.716 billion in 1Q23
BKR Quarterly Revenues History (Fun Trading)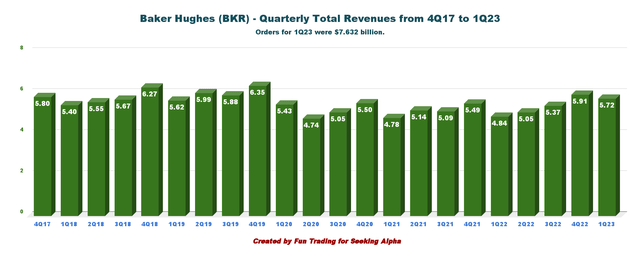
BKR’s total orders from all business segments in the first quarter 2023 were $7,632 million. Revenues were $5,716 million this quarter, up 18.2% from the same quarter a year ago and down 3.2% quarter-over-quarter. Adjusted operating income was $512 million for the quarter. Adjusted EBITDA was $782 million for the quarter.
The company posted total costs and expenses of $5,278 million in the first quarter, up from the year-ago quarter’s $4,556 million.
As I said earlier, Baker Hughes reorganized its company from four segments to two operating segments. Effective Oct 1, 2022, the two operating segments are Oilfield Services and Equipment and Industrial & Energy Technology.
1.1 – Oilfield Services & Equipment
Revenues were $3.577 million, up 19% from last year of $3,017 million. Operating income from the segment was $371 million, up from $213 million in the first quarter of 202,2, due to higher revenues in most product lines.
1.2 – Industrial & Energy Technology
Revenues totaled $2,138 million, up 18% from the last year or $1,818 million. The segment reported an income of $241 million, unchanged from 1Q22. Revenues were up this quarter due to higher contributions from the Gas Technology segment.
1.5 – 2Q23 and FY23 Positive outlook
Based on the mid-point, revenue for 2Q23 is expected to be between $6.1-$6.5 billion or up 9.3% QoQ.
BKR 2023 Outlook (BKR presentation)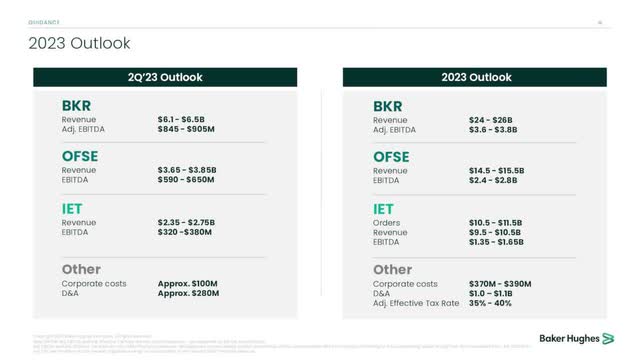
2 – Free cash flow was $151 million in 1Q23
BKR Quarterly Free Cash Flow History (Fun Trading)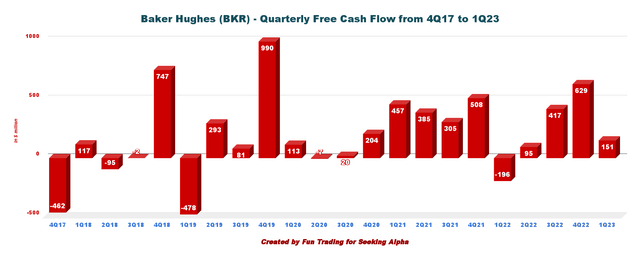
Note: Generic free cash flow is cash flow from operations minus capex. The company calculated Free cash flow differently and indicated $197 million for 1Q23.
Trailing 12-month free cash flow came in at $1,246 million, and the company had a free cash flow of $151 million in 1Q23.
This quarter, the quarterly dividend is $0.19 per share, or an annual cash payment of $760 million. The dividend yield is now 2.49%.
3 – The net debt was $4.24 billion in 1Q23
BKR Quarterly Cash versus Debt History (Fun Trading)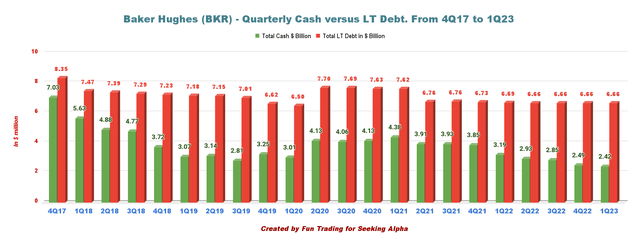
As of March 31, 2023, the company had cash and cash equivalents of $2,415 million, down significantly from $3,191 million in the first quarter of 2022.
At the end of the first quarter, Baker Hughes had long-term debt of $6,659 million (including $684 million in current debt), with a debt-to-capitalization of 31.4% from 31.7% the preceding quarter (see chart above).
Technical Analysis (Short Term) and Commentary
BKR TA Chart Short-Term (Fun Trading StockCharts)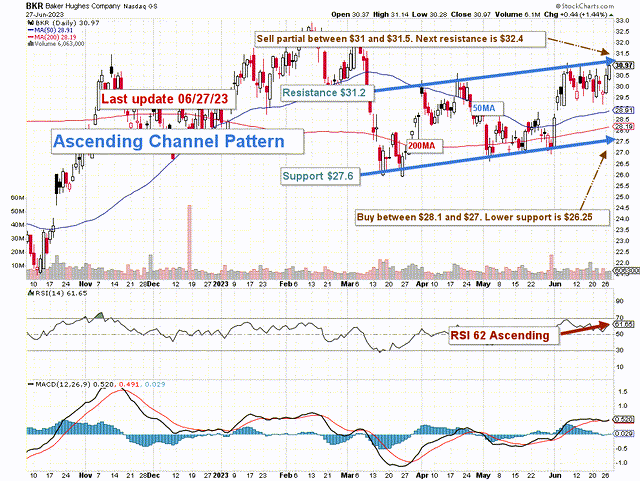
Note: The chart includes the effect of the dividend.
BKR forms an ascending channel pattern with resistance at $31.2 and support at $27.6. RSI is 62, which suggests that we are close to resistance and taking some profit soon is reasonable. Ascending channel patterns are short-term bullish, but these patterns often form within longer-term downtrends as continuation patterns. Thus, be careful here.
The general strategy I usually promote is to keep a core long-term position and use about 40% to trade LIFO while waiting patiently for a higher final price target to sell your core position above $33-$35.
Thus, I recommend selling partially between $31 and $31.5 with possible higher resistance at $32.4. Conversely, buying back BKR on any weakness between $28.1 and $27 is reasonable, with possible lower support at $26.25.
Warning: The TA chart must be updated frequently to be relevant. It’s what I’m doing in my stock tracker. The chart above has a possible validity of about a week. Remember, the TA chart is a tool only to help you adopt the right strategy. It is not a way to foresee the future. No one and nothing can.
Read the full article here

