
A Quick Take On AiXin Life International, Inc.
AiXin Life International, Inc. (OTCQX:AIXN) has filed to raise $7 million in an IPO of its common stock, according to an S-1/A registration statement.
The firm designs and manufactures vitamins and other supplements for the Chinese market.
Given the firm’s recent uneven revenue and operating results combined with the heightened risks of its market focus and excessive valuation assumptions, my outlook on the IPO is Neutral [Hold].
AiXin Overview
Chengdu, PRC-based AiXin Life International, Inc. was founded to create a range of nutritional and wellness supplements and operate a growing number of retail pharmacies in the PRC.
Management is headed by founder, president, Chairman and CEO Mr. Quanzhong Lin, who has been with the firm since its inception in 2008 and was previously the founder of various other businesses in the industries of pharmacy, retail stores, hotel management services and international tourism.
The company’s primary offerings include the following:
-
Nutritional products
-
Wellness supplements
-
Herbs and greens
-
Traditional Chinese remedies
-
Functional products
-
Weight management tools
-
Probiotics
-
Retail pharmacy network
As of March 31, 2023, AiXin has booked fair market value investment of $14.6 million from investors.
AiXin – Customer Acquisition
The firm sells its products and those of other companies through an omnichannel approach via retail, wholesale, company-owned pharmacies, direct marketing and online e-commerce channels.
The company operates thirteen retail pharmacies in the Chengdu region and has plans to expand its footprint.
Selling expenses as a percentage of total revenue have trended higher as revenues have fluctuated, as the figures below indicate:
|
Selling |
Expenses vs. Revenue |
|
Period |
Percentage |
|
Three Mos. Ended March 31, 2023 |
25.3% |
|
2022 |
29.1% |
|
2021 |
15.4% |
(Source – SEC)
The Selling efficiency multiple, defined as how many dollars of additional new revenue are generated by each dollar of Selling expense, rose to 1.8x in the most recent reporting period, as shown in the table below:
|
Selling |
Efficiency Rate |
|
Period |
Multiple |
|
Three Mos. Ended March 31, 2023 |
1.8 |
|
2022 |
-0.5 |
(Source – SEC)
AiXin’s Market & Competition
According to a 2023 market research report by Grand View Research, the global market for dietary supplements was an estimated $164 billion in 2022 and is forecast to reach $327 billion by 2030.
This represents a forecast CAGR of 9.0% from 2023 to 2030.
The main drivers for this expected growth are a growing consumer awareness of personal health and wellness products as well as increased R&D from product makers.
Also, below is a chart showing the historical and projected future market size by ingredient for dietary supplements in China:
China Dietary Supplements Market (Grand View Research)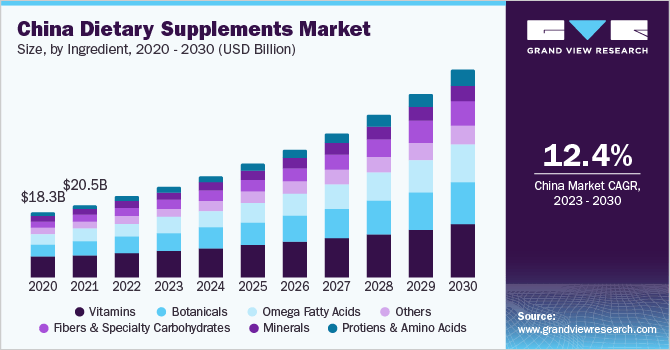
Major competitive or other industry participants include:
-
Amway
-
Abbott (ABT)
-
Bayer AG (OTCPK:BAYZF)
-
Glanbia plc (OTCPK:GLAPF)
-
Pfizer (PFE)
-
Archer-Daniels-Midland (ADM)
-
GlaxoSmithKline plc (GSK)
-
Nu Skin (NUS)
-
Herbalife Nutrition (HLF)
-
Nature’s Sunshine Products (NATR)
-
Bionova
-
Arkopharma
-
Nestle (OTCPK:NSRGY)
AiXin Life International, Inc. Financial Performance
The company’s recent financial results can be summarized as follows:
-
Fluctuating topline revenue
-
Variable gross profit and gross margin
-
Higher operating losses
-
Growing cash used in operations
Below are relevant financial results derived from the firm’s registration statement:
|
Total Revenue |
||
|
Period |
Total Revenue |
% Variance vs. Prior |
|
Three Mos. Ended March 31, 2023 |
$ 754,713 |
80.3% |
|
2022 |
$ 2,708,560 |
-11.7% |
|
2021 |
$ 3,066,233 |
|
|
Gross Profit (Loss) |
||
|
Period |
Gross Profit (Loss) |
% Variance vs. Prior |
|
Three Mos. Ended March 31, 2023 |
$ 579,225 |
96.9% |
|
2022 |
$ 1,605,400 |
-36.6% |
|
2021 |
$ 2,530,748 |
|
|
Gross Margin |
||
|
Period |
Gross Margin |
% Variance vs. Prior |
|
Three Mos. Ended March 31, 2023 |
76.75% |
6.5% |
|
2022 |
59.27% |
-28.2% |
|
2021 |
82.54% |
|
|
Operating Profit (Loss) |
||
|
Period |
Operating Profit (Loss) |
Operating Margin |
|
Three Mos. Ended March 31, 2023 |
$ (551,970) |
-73.1% |
|
2022 |
$ (2,569,459) |
-94.9% |
|
2021 |
$ (26,938) |
-0.9% |
|
Comprehensive Income (Loss) |
||
|
Period |
Comprehensive Income (Loss) |
Net Margin |
|
Three Mos. Ended March 31, 2023 |
$ (505,242) |
-66.9% |
|
2022 |
$ (6,907,219) |
-915.2% |
|
2021 |
$ (144,953) |
-19.2% |
|
Cash Flow From Operations |
||
|
Period |
Cash Flow From Operations |
|
|
Three Mos. Ended March 31, 2023 |
$ (472,681) |
|
|
2022 |
$ (1,624,565) |
|
|
2021 |
$ (57,804) |
|
|
(Glossary Of Terms) |
(Source – SEC)
As of March 31, 2023, AiXin had $496,918 in cash and $5.6 million in total liabilities.
Free cash flow during the twelve months ending March 31, 2023, was negative ($1.8 million).
AiXin Life International, Inc. IPO Details
AiXin intends to raise $7 million in gross proceeds from an IPO of its common stock, offering 1.75 million shares at a proposed price of $4.00 each.
No existing shareholders have indicated an interest in purchasing shares at the IPO price.
Assuming a successful IPO, the company’s enterprise value at IPO would approximate $72 million, excluding the effects of underwriter over-allotment options.
The float to outstanding shares ratio (excluding underwriter over-allotments) will be approximately 8.86%. A figure under 10% is generally considered a ‘low float’ stock which can be subject to significant price volatility.
As a foreign private issuer, the company can choose to take advantage of reduced, delayed or exempted financial and senior officer disclosure requirements versus those that domestic U.S. firms are required to follow.
Management says it will use the net proceeds from the IPO as follows:
Proposed Use Of Proceeds (SEC)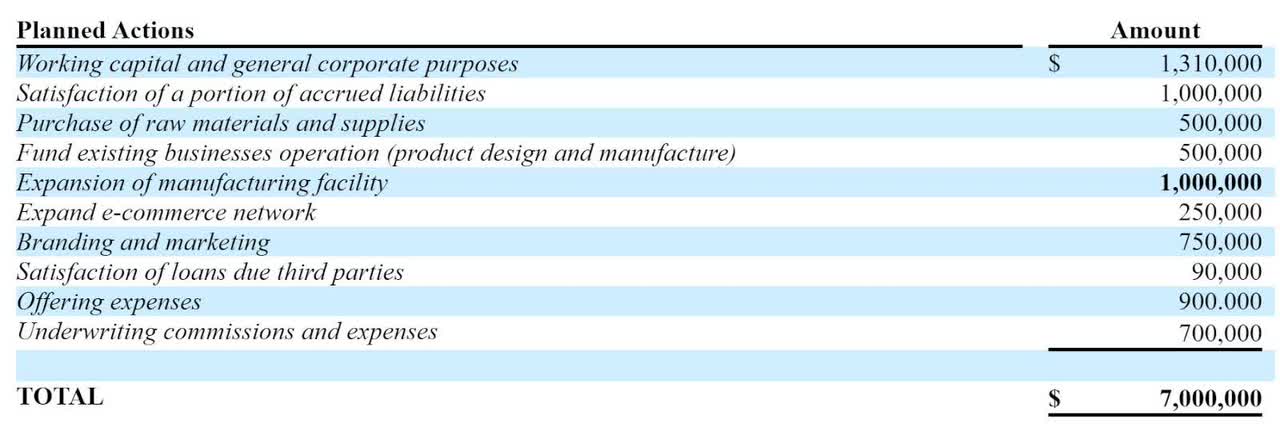
Management’s presentation of the company roadshow is not available.
Regarding outstanding legal proceedings, leadership says the company is not currently a party to any legal proceedings that would have a material adverse effect on its financial condition or operations.
The sole listed bookrunner of the IPO is Network 1 Financial Securities.
Valuation Metrics For AiXin
Below is a table of relevant capitalization and valuation figures for the company:
|
Measure [TTM] |
Amount |
|
Market Capitalization at IPO |
$78,999,368 |
|
Enterprise Value |
$72,083,817 |
|
Price / Sales |
25.95 |
|
EV / Revenue |
23.68 |
|
EV / EBITDA |
-30.68 |
|
Earnings Per Share |
-$0.33 |
|
Operating Margin |
-77.16% |
|
Net Margin |
-219.81% |
|
Float To Outstanding Shares Ratio |
8.86% |
|
Proposed IPO Midpoint Price per Share |
$4.00 |
|
Net Free Cash Flow |
-$1,752,195 |
|
Free Cash Flow Yield Per Share |
-2.22% |
|
Debt / EBITDA Multiple |
-0.04 |
|
CapEx Ratio |
-10.06 |
|
Revenue Growth Rate |
80.26% |
|
(Glossary Of Terms) |
(Source – SEC)
Commentary About AiXin’s IPO
AIXN is seeking U.S. public capital market funding for a variety of corporate investments and for working capital requirements.
The company’s financials have generated variable topline revenue, fluctuating gross profit and gross margin, increased operating losses and higher cash used in operations.
Free cash flow for the twelve months ending March 31, 2023, was negative ($1.8 million).
Selling expenses as a percentage of total revenue have trended higher as revenue has varied; its Selling efficiency multiple rose to 1.8x in the most recent reporting period.
The firm currently plans to pay no dividends for the foreseeable future. The company is subject to numerous laws and regulations regarding dividend payments, if any, from China and the British Virgin Islands.
AiXin’s recent capital spending history indicates it has spent lightly on capital expenditures even as it has used operating cash.
The market opportunity for health and wellness supplements is large and expected to grow at a reasonably strong rate of growth in the coming years.
Additionally, the market for traditional Chinese medicine products is expected to grow as support for the industry has grown from government policies.
Like other companies with Chinese operations seeking to tap U.S. markets, the firm operates within a WFOE structure or Wholly Foreign Owned Entity. U.S. investors would only have an interest in an offshore firm with interests in operating subsidiaries, some of which may be located in the PRC. Additionally, restrictions on the transfer of funds between subsidiaries within China may exist.
The Chinese government’s crackdown on certain IPO company candidates combined with added reporting and disclosure requirements from the U.S. has put a damper on Chinese or related IPOs resulting in generally poor post-IPO performance.
Also, a potentially significant risk to the company’s outlook is the uncertain future status of Chinese company stocks in relation to the U.S. HFCA Act, which requires delisting if the firm’s auditors do not make their working papers available for audit by the PCAOB.
Prospective investors would be well advised to consider the potential implications of specific laws regarding earnings repatriation and changing or unpredictable Chinese regulatory rulings that may affect such companies and U.S. stock listings.
The Chinese government may intervene in the company’s business operations or industry at any time and without warning and has a recent history of doing so in certain industries.
Additionally, post-IPO communications from the management of smaller Chinese companies that have become public in the U.S. has been spotty and perfunctory, indicating a lack of interest in shareholder communication, only providing the bare minimum required by the SEC and a generally inadequate approach to keeping shareholders up-to-date about management’s priorities.
Network 1 Financial Securities is the sole underwriter, and the five IPOs led by the firm over the last 12-month period have generated an average return of negative (60.6%) since their IPO. This is a bottom-tier performance for all major underwriters during the period.
Business risks to the company’s outlook as a public company include having substantially all of its operations in China, which can present opportunities as well as sudden changes due to regulatory policy shifts.
As for valuation expectations, management is asking investors to pay an Enterprise Value/Revenue multiple of approximately 23.7x.
Given the firm’s recent uneven revenue and operating results combined with the heightened risks of its market focus and excessive valuation assumptions, my outlook on the IPO is Neutral [Hold].
Expected IPO Pricing Date: To be announced.
Editor’s Note: This article discusses one or more securities that do not trade on a major U.S. exchange. Please be aware of the risks associated with these stocks.
Read the full article here
