
Research Brief
As we approach another week of earnings season, there is one regional bank based in my home state in the NYC area that is worth doing a pre-earnings research article on today, as its next earnings release is right around the corner this Thursday Jul 27th.
Valley National Bancorp (NASDAQ:VLY) is the parent company of Valley National Bank, a known brand in northern New Jersey with company roots going back to 1927.
Notable items from its company website, corporate profile: $54B in assets, branches in 6 states, trades on the Nasdaq (NDAQ), headquarters in New Jersey, market cap of $4.7B. Worthy to mention is that institutional ownership is 75%, among the biggest being BlackRock (BLK) and Vanguard, owning 109MM shares between the two of them.
Today, we are analyzing whether this regional bank is a value-buying opportunity where an investor can own a piece of the bank’s existing income stream and add it to their portfolio of bank stocks for some “regional” diversification.
Ratings Methodology
Our goal is to find undervalued stocks of companies with solid financial fundamentals that pay competitive dividend yields. Our key industry focus is tech, financials, insurance, and innovation.
To simplify my rating of an equity, I have broken it down into whether I would recommend or not recommend based on these individual factors:
- Valuation vs Sector Average.
- Dividend Yield vs Sector Average.
- Positive YoY Net Income Growth.
- Capital & Liquidity Strength
- Stock Price vs 200 Day SMA.
If I recommend on all 5 categories, it is a “strong buy”, 4 categories, is a “buy”, 3 is a hold, and less than that is a sell rating. Then I compare my rating to the consensus ratings from Seeking Alpha & Wall Street.
Valuation vs Sector Average: Recommend
In our first category to discuss, we like to get right into the valuation numbers. The two metrics used are the GAAP-based forward price-to-earnings (P/E) ratio and the forward price-to-book (P/B) ratio, then comparing them both to the sector average. We are looking for valuations that are close to or lower than the sector average by at least 5 to 10%.
Based on official valuation data taken from Seeking Alpha, we are impressed by the forward P/E of 8.27, which got a “B+” grade from Seeking Alpha and is close to 18% below its sector average.
Valley Bank – P/E ratio on July 23 (Seeking Alpha)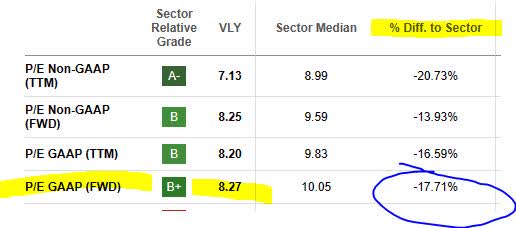
In terms of the forward P/B ratio, it is currently 0.73, getting a grade of “A” from Seeking Alpha and is over 30% below the sector average.
Valley Bank – P/B ratio on July 23 (Seeking Alpha)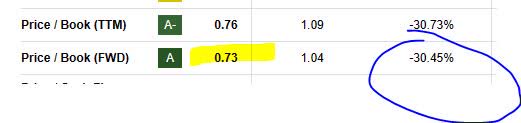
Usually, we prefer a P/B below 1.0, and therefore consider this stock undervalued on both metrics, and would recommend on this category.
Dividend Yield vs Sector Average: Recommend
Our next category to look at is the dividend yield and how it compares to the sector average.
The near 5% yield gets our attention, currently at 4.68%, paying $0.11 a share on a quarterly basis, based on official dividend data.
Somewhat less impressive is 5-year dividend growth, which went from an annual dividend of $0.66 in 2018 to $0.44 the next year, and remaining so through 2022, as the chart below shows.
Valley Bank – 5 year dividend growth (Seeking Alpha)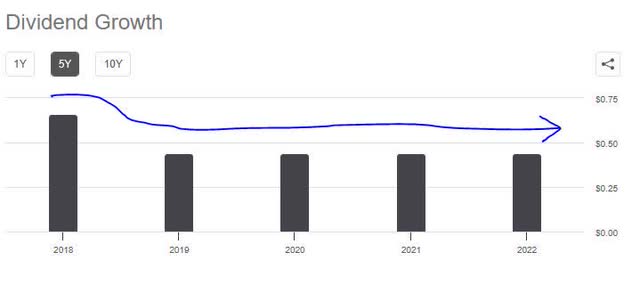
However, where it lacks in 5-year dividend growth it makes up for dividend yield vs the sector average. Consider the table below, which shows that the current yield is actually over 26% above the sector average:
Valley Bank – dividend yield vs sector average (Seeking Alpha)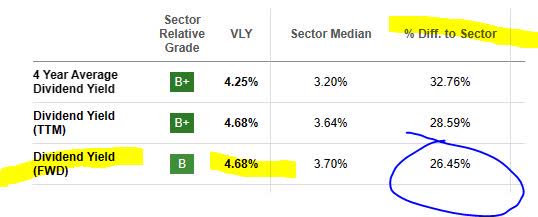
This figure exceeds our target of the dividend yield being at least 5 to 10% above the sector average.
Based on this evidence, we recommend this stock in the category of dividend yield in comparison to sector average.
Positive YoY Net Income Growth: Recommend
Next, as we get into the topics of net income, capital & liquidity, as a reference we will use the company’s Q1 earnings presentation, available from their investor relations site.
One positive to mention from their Q1 results, as shown below, is a $29.9MM YoY increase in net income, as well as a slight YoY increase in diluted earnings per share:
Valley Bank – net income YoY (Valley Bank – Q1 presentation)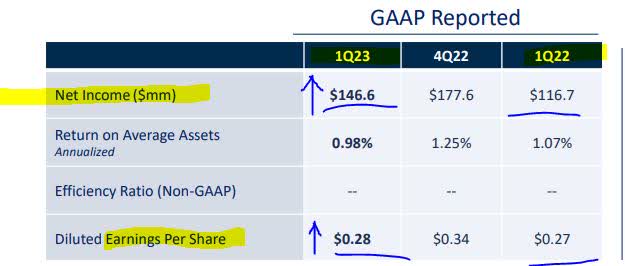
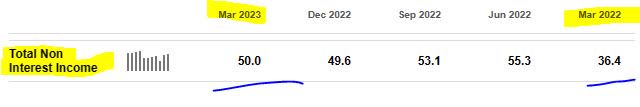
From a top-line view, it appears some key drivers are YoY growth in both net interest income as well as non-interest income, which both showed YoY growth vs the same quarter a year ago:
Valley Bank – net interest income (Valley bank – q1 presentation) valley bank – non interest income (Valley bank – q1 presentation)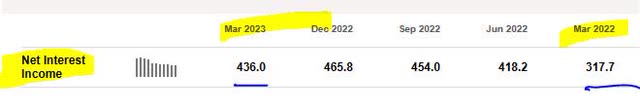
This is also an example of income diversification as well, in my opinion. The reason I don’t simply look at revenue growth but net income is because I want to see a company that manages expenses efficiently as well, so those analysts who only care about the top-line are not considering this.
Although the core business of a bank usually depends on interest income, most banks I have reviewed also have a portfolio of other income streams. The following is a good example of non-interest income has performed for this bank YoY:
Valley bank – non-interest income growth by category (Valley bank – Q1 results presentation)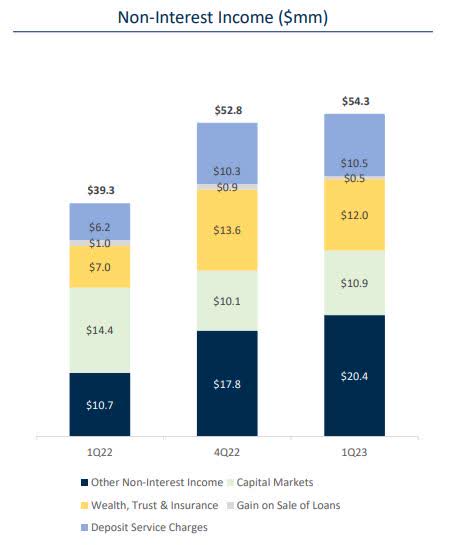
I think that the positive income momentum will continue looking forward towards Q2 results, with a 50% chance the bank beats slightly on earnings estimates, based on it having beat 2 of the last 4 estimates, as shown below:
Valley bank – earnings surprises (Seeking Alpha)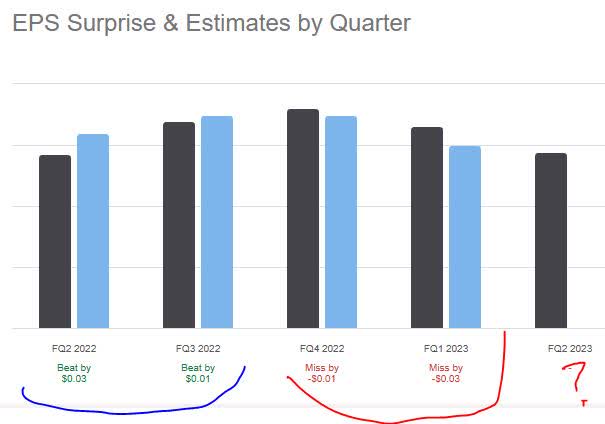
Based on the evidence found, I recommend this stock on the basis of positive net income growth YoY.
Capital & Liquidity Strength of Company: Recommend
In this category, we have chosen to discuss both capital & liquidity in the same section even though they are not entirely the same thing, but both important to the solvency & business continuity of a bank.
First, it is notable to mention that their CET1 ratio is well above the well-known Basel III standards, even though it is slightly lower YoY:
Valley Bank – CET1 ratio (Valley Bank – Q1 presentation)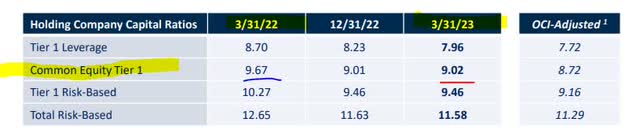
It is important to note what benchmarks I am comparing this data to, and for that I reference the requirements that a financial institution have a total risk-based capital ratio of 8% under Dodd-Frank rules, and tier 1 risk-based capital ratio of 4.5%.
In this case, this bank is well in excess of the regulatory baseline required, and despite being a smaller regional bank, as the table below shows, its total risk-based capital exceeds $5.65B.
Valley bank – regulatory capital (Valley bank – q1 presentation)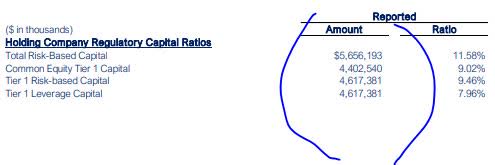
Key liquidity notables to mention:
The firm mentioned in their Q1 commentary that they have “substantial excess liquidity available from on- and off-balance sheet sources.”
In addition, they drove liquidity through additional deposits, as well as use of the FHLB:
Bolstered on-hand liquidity with fully FDIC-insured indirect customer deposits sourced across substantial dealer network. Utilized short-term FHLB advances to quickly build excess liquidity out of an abundance of caution. Excess liquidity continues to normalize as FHLB advances mature.
Looking forward to Q2 results soon, I expect similar or better results as in this prior quarter, in particular would like to see the CET1 improve even better. For the moment, I recommend this stock in the category of capital & liquidity strength, shown by the evidence.
Stock Price vs 200 Day SMA: Recommend
Going into the new trading week, as of Sunday July 23rd the last share price for this stock closed at $9.41, as shown in the chart below:
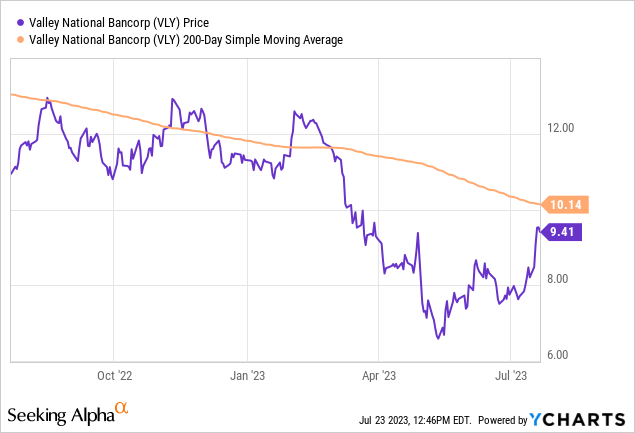
In comparison to the 200 day simple moving average of $10.14, which we are tracking, the most recent share price is about 7.2% below the SMA.
Our own portfolio strategy & trading idea we have discussed in recent articles is trading a “range” that is 5% above or below the 200 day SMA. That would put our trading range for this stock currently between $9.63 and $10.65. Since this stock is currently below that range, we consider it a buying opportunity for sure, and recommend it in terms of share price vs 200 day SMA.
To help illustrate our investing idea, we have created the following simulation spreadsheet, so as to “show” and not just tell.
Portfolio Simulator (Albert Anthony & Co.)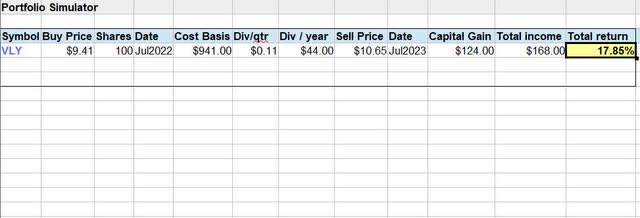
As you can see in our investing idea above, we are buying 100 shares at $9.41, the most recent share price as of the writing of this article and holding it for one year to get the full year dividend income, then selling at 5% above the current 200 day SMA. Our total return on capital is projected to be 17.85%.
The risk to this investing idea, and tracking the long-term moving average, is that it can also take a negative turn after we buy the shares and thereby causing unrealized losses (paper losses) to our portfolio.
We are aware that selling covered call options and earning premiums from them is one way to offset some of that risk, as we have done so in the past, however we will not get into the complexities of options trading in this article, for brevity’s sake.
Nevertheless, we think tracking the 200 day long-term average is less risky than trying to “time” the short-term averages, and our current investing idea rests on that notion. Your constructive feedback in the comments is certainly welcome!
Ratings Score: Strong Buy
Today this stock won all 5 of my rating categories and is getting a strong buy rating. This is slightly more bullish than the Wall Street consensus of a buy rating, as shown below, and much more bullish than the consensus from SA analysts and the SA quant system which gave it a hold rating:
Ratings Consensus (Seeking Alpha)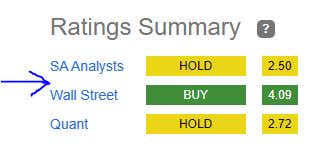
Risks to my Outlook:
A risk that could impact my overly bullish outlook on this stock is the bank’s exposure to commercial real estate, particularly office properties, as well as any negative trends facing their loan book such as net charge-offs and non-performing loans. This could scare away some investors from this stock.
So, I decided to see what the company itself had to say about this in their Q1 presentation, to get some idea of what the Q2 figures may look like.
First off, a notable positive is that the percentage of non-accrual loans to total loans has declined going into the end of Q1, as shown in the chart below, bringing the amount down to just 0.50% of total loans:
Valley bank – non-accrual loans (Valley Bank – q1 presentation)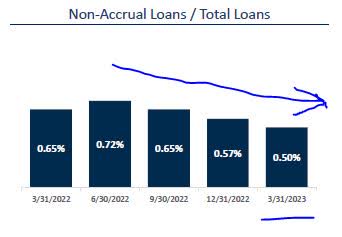
I project that this downward trend will continue going into the Q2 results, predicting non-accrual loans to be somewhere in the range of 0.40% – 0.50% of total loans.
Slightly more concerning, as shown below, is the uptick of net charge-offs, however at the end of Q1 they are still just 0.25% of avg. loans:
Valley Bank – net chargeoffs (Valley bank – Q1 presentation)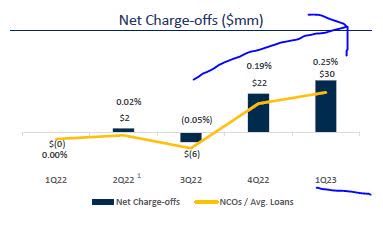
I expect for Q2 results this amount to remain similar, in the range of 0.20% – 0.30%.
Now the fun part, the question you are all waiting for.. what is their exposure to office properties at the end of Q1?
As it turns out, just 10% of their CRE portfolio!
Valley bank – CRE portfolio (Valley bank – Q1 presentation)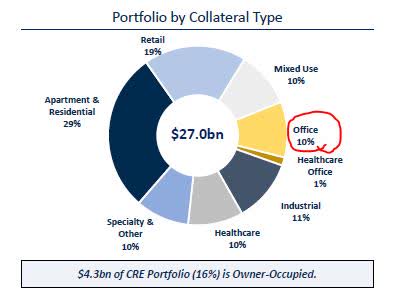
The majority of their portfolio is tied to apartments/residential, so with office making up less than a quarter of the pie I would consider it a minor risk exposure. At the same time, no one property class makes up over half the portfolio.
I project these numbers to be similar in the Q2 figures and would not be surprised if the bank decides to limit further office exposure going forward, with a goal of bringing it under 10% of the portfolio. Certainly I would like to hear management commentary in Q2 regarding the performance of the office portfolio.
All in all, this evidence should provide a counterweight to investors concerned about my bullish sentiment on this stock.
Analysis Wrap Up
To wrap up today’s analysis, here are key points we discussed.
I am giving this stock a strong buy rating today, as it won in 5 of my rating categories. This rating is more bullish than both the Wall Street & Seeking Alpha consensus.
Positives: Dividend yield vs sector average, stock price vs 200 day SMA, P/E and P/B valuation vs sector average, positive net income growth, liquidity & capital strength of company.
A risk that could dampen my bullish outlook on this bank is their exposure to bad loans, net charge-offs, and commercial real estate, especially office property, and this risk has been addressed.
In closing, I continue to look for hidden dividend gems among the regional banks, and in my opinion this has been one of them. I am adding it to my watchlist and would consider including it as a small percentage of a larger bank stock portfolio, to provide regional & dividend yield diversification.
Read the full article here
