The U.S. stock market, as measured by the S&P 500 Index
SPX,
has continued to fall, even as oversold conditions abound and increase. But “oversold does not mean buy,” and we do not have any confirmed buy signals yet.
There are potential buy signals in several areas, but we will not act on those until they are confirmed. The stock market can fall sharply while it is oversold — witness October 2008 and March 2020. By making a series of lower highs and lower lows, SPX is in a defined downtrend (red lines on the accompanying SPX chart), and that is reason enough to carry a “core” bearish position.
There is overhead resistance at 4330 (the old support) up to 4400, where there is a gap on the SPX chart. Oversold rallies can spring up at any time. Without other confirmation, though, they are usually short-lived affairs that die out after reaching the declining 20-day Moving Average.
That 20-day MA is current at 4380 and dropping rapidly. Those numbers are all within a short distance of each other, and they represent resistance to any rallies. The previous resistance points of 4540 and 4600 are still there, but they are not significant as long as SPX remains in this downtrend.
There is support near 4200, because it was previously resistance (blue line on chart). In addition, the still-rising 200-day Moving Average of SPX is near 4200 as well.
Meanwhile, SPX has continued to close below its -4σ “modified Bollinger Band” (mBB), which is an oversold condition that is a setup for an eventual “classic” mBB buy signal. That will occur when SPX closes above its -3σ Band. That would occur on a close above 4267 by SPX. That alone does not complete the McMillan Volatility Band (MVB) buy signal, though. Further confirmation would be needed.
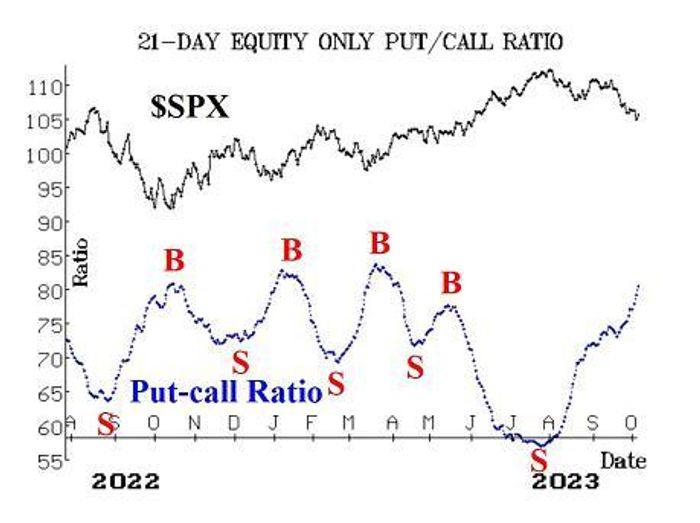
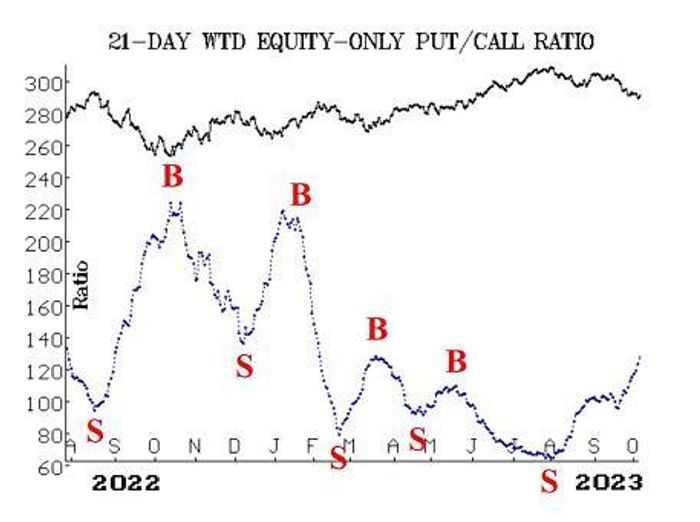
Equity-only put-call ratios are racing higher now, as put volume is increasing dramatically since the market fell below the important support level at 4330. Both of these equity-only ratios are on sell signals and will remain there until they roll over and begin to trend lower. In addition, the rising total put-call ratio has now reached oversold territory, and it too will generate a buy signal when it rolls over and forms a local maximum on its chart.
Just to throw another data point in here: the CBOE equity-only put-call ratio was above 1.0 on Oct. 4; that is a rare oversold condition that — if repeated within the next five trading days — is a buy signal for the stock market.
Breadth has been quite negative, as one would imagine with SPX trading below the lower bands. Both breadth oscillators remain on sell signals. They are deeply oversold but will not generate buy signals until there are at least two and probably three days of positive breadth.
“ Some stocks hitting new lows are trading at prices nearly as low as the lows of March 2020. ”
The NYSE-based “New Highs vs. New Lows” indicator remains on a sell signal. New Lows have continued to dominate. One day this week there were 400 new lows on the NYSE alone. A year ago was the supposed market low in October 2022. At least it was the low for SPX, which is dominated by the big-cap tech stocks that have propelled it 20% higher since then.
However, the “average” stock is faring far worse. Some stocks hitting new lows are trading at prices nearly as low as the lows of March 2020. This indicator will remain bearish until there are 100 or more New Highs on the NYSE for two consecutive days.
The volatility complex has been the most bullish of our indicators all year. That is still the case, although their strength is wavering a bit. VIX
VIX
VX00,
is in “spiking,” mode and when that is the case, stocks can fall sharply (and they have). Eventually, VIX will drop at least 3.0 points from its peak, and a “spike peak” buy signal will be issued. That hasn’t taken place yet. So far, the highest VIX “print” has been 20.88 for this spiking period.
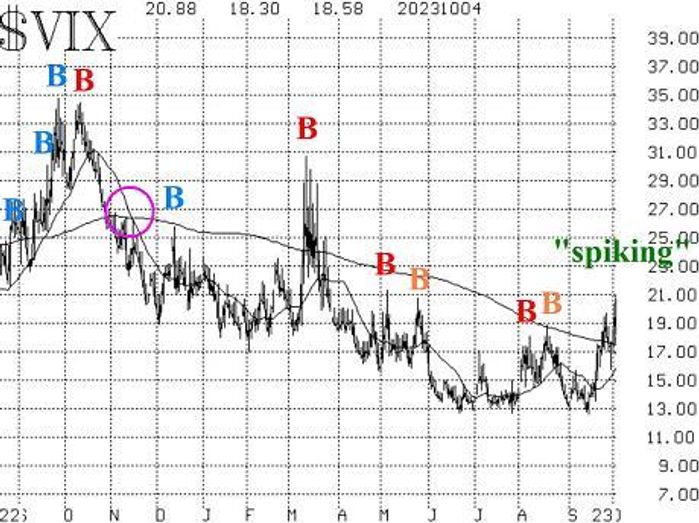
The trend of VIX buy signal that first appeared in the circled area on the above VIX chart, back in November 2022, has been stopped out. Currently there is no trend to the VIX chart, by our definition, since VIX is above the 200-day Moving Average, while the 20-day MA is below it. If the 20-day crosses above the 200-day, and VIX is still above the 200-day that would be an intermediate-term sell signal.
Finally, the construct of volatility derivatives is of some concern. As long as the term structures of the VIX futures and of the CBOE Volatility Indices slope upward, all is well. But the VIX futures term structure has flattened considerably and that could be a cause for concern. The front-month October VIX futures are trading 30 cents below November, and as long as that is the case, it’s still a bullish construct. However, should October rise above November, that could be a highly bearish warning sign. That happened in February 2018 and again in February 2020, and both times the market literally collapsed within a week afterwards.
So, we continue to hold a “core” bearish position. We will trade other confirmed signals around that, but we have not had any confirmed buy signals yet. These oversold conditions have persisted for quite a while. Normally a “spike peak” buy signal or a “classic” mBB buy signal will occur fairly quickly after the setup takes place. But not this time, which is why we need confirmation, not just a setup (i.e., not just an oversold condition), before going long.
New recommendation: Potential VIX “spike peak” buy signal:
We made this recommendation last week, but VIX has still not come out of “spiking” mode. As you’ve seen, the stock market can fall sharply while VIX is in “spiking” mode. However, a VIX “spike peak” buy signal will eventually occur. Specifically, it will take place when VIX closes at least 3.0 points below the highest price it reached while in this most recent “spiking” mode. So far that high is 20.88, but keep track of VIX to see if it goes higher than that before eventually retreating.
IF VIX closes at least 3.00 points below the highest price that it has reached from September 27th going forward (currently 20.88), then Buy 1 VIX Nov (17th) at-the-money call and Sell 1 VIX Nov (17th) call with a striking price 15 points higher.
This signal, if completed, will last for 22 trading days. It would be stopped out by a VIX close higher than the high point that triggered the recommendation.
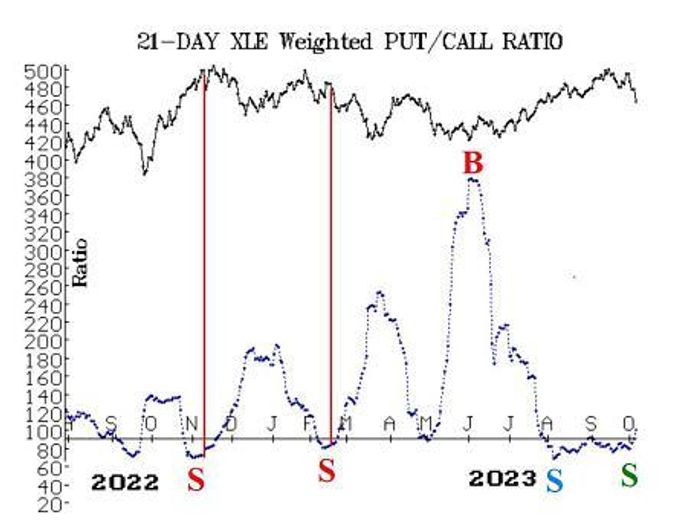
New recommendation: Energy Select Sector SPDR
XLE
puts
Energy stocks have broken down this past week, and there is a new weighted put-call ratio sell signal for XLE (and for many of the individual oil stocks as well).
Buy 3 XLE Nov (17th) 86 puts in line with the market.
XLE: 85.75 Nov (17th) 86 put: 2.99 bid, offered at 3.05
We will hold these puts as long as the weighted put-call ratio remains on a sell signal for XLE.
Follow-up action:
All stops are mental closing stops unless otherwise noted.
We are using a “standard” rolling procedure for our SPY spreads: in any vertical bull or bear spread, if the underlying hits the short strike, then roll the entire spread. That would be roll up in the case of a call bull spread, or roll down in the case of a bear put spread. Stay in the same expiration and keep the distance between the strikes the same unless otherwise instructed.
Long 8 CRON
CRON,
Oct (20th) 2 calls: Option volume continues to be very strong. Hold without a stop.
Long 2 EW
EW,
Oct (20th) 70 puts: We have rolled down a couple of times here. The weighted put-call ratio for EW is no longer on a sell signal. However, with the stock in such a steep downtrend, we are going to set a trailing stop here. Sell these puts if EW closes above 72.50.
Long 1 SPY
SPY
Oct (20th) 428 put: Bought in line with the equity-only put-call ratio sell signals. We are going to hold this put until the weighted ratio rolls over to a buy. Roll down every time this put becomes at least 8 points in-the-money.
Long 2 EQR
EQR,
Oct (20th) 60 puts: Continue to hold as long as the weighted put-call ratio for EQR remains on a sell signal.
Long 3 X
X,
Oct (13th) 31 calls: Hold without a stop while takeover offers are sort out.
Long 0 PSX
PSX,
Oct (13th) 123 calls: These calls were stopped out when the underlying closed below our stop (118) on October 3rd. There was no specific news, but just a heavy selling of oil stocks that day and the next.
Long 3 ADM
ADM,
Oct (20th) 76 puts: Hold this position as long as the weighted put-call ratio for ADM is on a sell signal.
Long 0 TSHA
TSHA,
Oct (20th) 2.5 calls: These calls were sold when TSHA closed below our stop at 2.75, on October 3rd.
Long 0 TEVA
TEVA,
Oct (20th) 10 calls: These calls were sold when TEVA closed below our stop at 9.75, on October 3rd.
Long 1 SPY Oct (20th) 428 put and Short 1 SPY Oct (20th) 408 put: Established in line with the “New Highs vs. New Lows” sell signal. Stop out if New Highs outnumber New Lows on the NYSE for two consecutive days.
Long 3 CHEF
CHEF,
Nov (17th) 25 puts: Roll down to the Nov (17th) 20 puts and lower the trailing stop to 22.80.
Long 2 DLR
DLR,
Nov (10th) 118 puts: Hold these puts as long as the DLR weighted put-call ratio is on a sell signal.
All stops are mental closing stops unless otherwise noted.
Send questions to: [email protected].
Lawrence G. McMillan is president of McMillan Analysis, a registered investment and commodity trading advisor. McMillan may hold positions in securities recommended in this report, both personally and in client accounts. He is an experienced trader and money manager and is the author of the best-selling book, Options as a Strategic Investment. www.optionstrategist.com
©McMillan Analysis Corporation is registered with the SEC as an investment advisor and with the CFTC as a commodity trading advisor. The information in this newsletter has been carefully compiled from sources believed to be reliable, but accuracy and completeness are not guaranteed. The officers or directors of McMillan Analysis Corporation, or accounts managed by such persons may have positions in the securities recommended in the advisory.
Read the full article here
