After days of steady selling, the NASDAQ
NDAQ
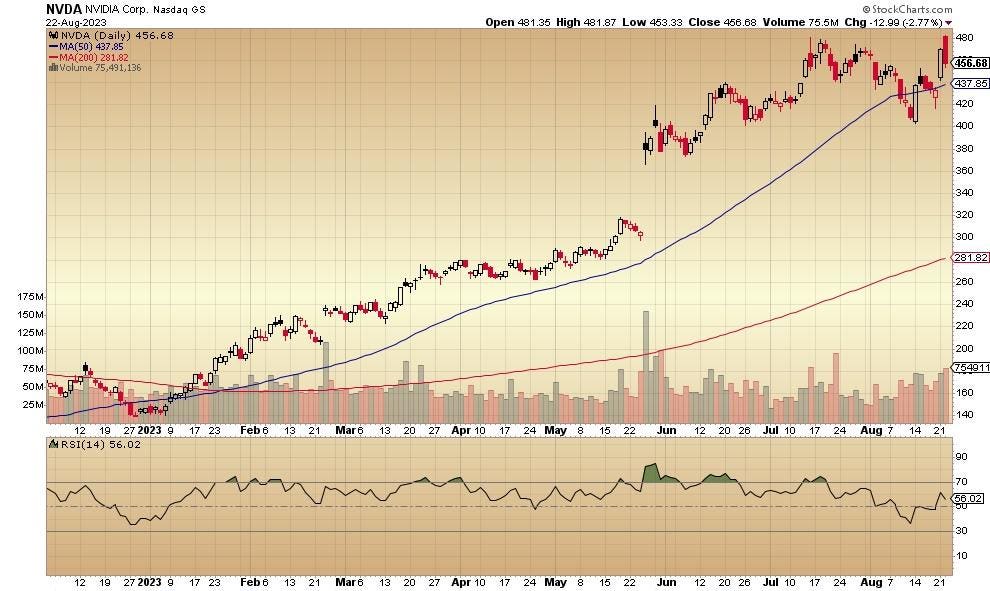
NVDIA looked like this on the daily price chart, just ahead of a highly expected earnings report:
Poorly programmed algorithms couldn’t wait to buy at the open and once the dumb machine-learned buys were done, smart sellers moved in and day-traded for easy profits. If you are involved with the coding for “at the open” algos, it might be a good idea to look at the minute-by-minute chart to re-learn how it works when sharper humans anticipate your action.
So, NVIDIA hits a higher high which is then called into question during the rest of the session. If earnings come in at a less than expected level, there might be issues. In the meantime, the stock continues to trade above its 50-day moving average (the blue line) and its 200-day moving average, generally a bullish look.
Here’s the daily price chart for Apple:
No new high for Apple on the rally — far from it. The 3-day up move off of the mid-August low is remarkably mild with an inability to even make it halfway back to the July highs. It remains below the 50-day moving average which has now begun to trend downward. You don’t get that former “hot tech stock” feeling here.
The Amazon daily price chart looks like this:
The stock could not make it to a higher price today even as the NASDAQ as a whole made it to up by .006%. The 50-day moving average seems to be a buy point for whatever algorithm is running things here — a drop below that level might change the tone. Right now, it’s awfully ho-hum.
Here’s the daily chart for Tesla:
The trading session started quite bullishly for Elon Musk’s EV company but then the sellers showed up and that black-ish candlestick pattern is not encouraging. Note that the price remains below the 50-day moving average which has begun to trend downward.
This is the daily chart for the NASDAQ-100:
Just when tech investors began to feel a little better about all of that August selling, here comes a -19% day to spoil all the fun. The index could not make it back above the 50-day moving average.
Maybe tomorrow or the rest of the week will be different. At least now we have a clearly delineated trading range: just above 14500 is the low and just below 16000 is the high.
Read the full article here
