The so-called Magnificent Seven grouping of technology stocks lost some of its luster this week after four of the seven moved into correction territory, meaning their stocks have fallen at least 10% from their recent peaks.
The corporate-bond market, in contrast, seems to like all seven names.
The group is made up of Facebook parent Meta Platforms Inc.
META,
-0.65%,
Apple Inc.
AAPL,
+0.28%,
Microsoft Corp.
MSFT,
-0.13%,
Nvidia Corp.
NVDA,
-0.10%,
Amazon. com Inc.
AMZN,
-0.57%,
Google parent Alphabet Inc.
GOOGL,
-1.89%
GOOG,
-1.80%
and Tesla Inc.
TSLA,
-1.70%.
One caveat: Tesla has no outstanding bonds. In the past, the electric-car maker issued convertible bonds, but they have all been converted into equity.
The group is credited with helping drive the stock market’s gains in the first half of the year, driven by excitement about artificial intelligence. But the rally has stalled in recent weeks as investors have fretted over the potential for U.S. interest-rate increases, surging Treasury yields and China worries, with property developer Evergrande filing for U.S. bankruptcy protection late Thursday.
On Thursday, Meta followed Apple, Microsoft and Nvidia into correction territory, as MarketWatch’s Emily Bary reported. Tesla, meanwhile, is in a bear market, meaning it’s down more than 20% from its recent peak.
Read: Have AI stocks like Nvidia reached bubble territory? Here’s what history can tell us.
The following series of charts from data-solutions provider BondCliQ Media Services show how many bonds each company has issued by maturity and how they have traded as the stocks have pulled back.
The first chart shows that Microsoft has by far the most bonds, mostly in the 30-year bucket. The software and cloud giant has more than $50 billion in long-term debt, according to its 2023 10-K filing with the Securities and Exchange Commission.
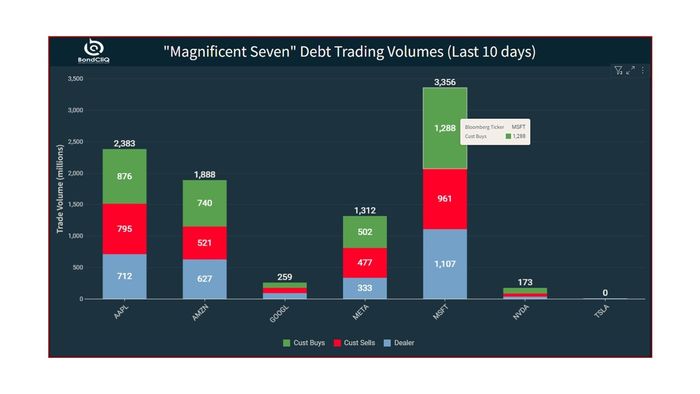
This chart shows trading volumes over the last 10 days, divided by trade type. The green shows customer buying, while the red is customer selling. The blue shows dealer-to-dealer flows. Microsoft, for example, has seen almost $1.3 billion in customer buying from dealers in the last 10 days and $960 million in customer sales to dealers.

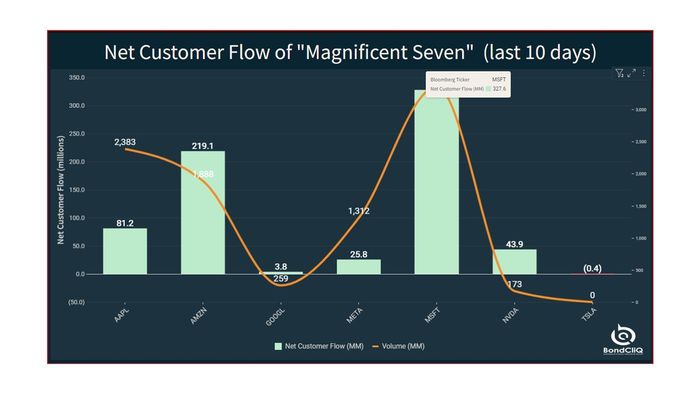
This chart shows that every name in the group has enjoyed better net buying in the last 10 days, with Microsoft leading the way.
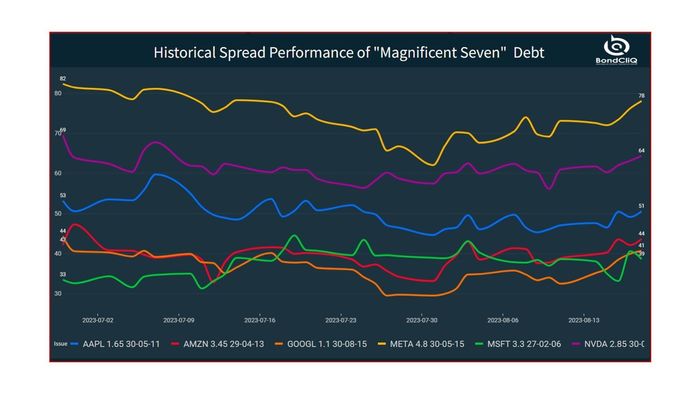
This chart shows spread performance over the last 50 days for an intermediate-term bond from each of the seven issuers. Most have tightened or remained steady over the period.
Read also: Red flags waving for tech stocks as AI bounce fades, China fears escalate
Apple’s stock entered correction Wednesday upon falling more than 10% from its July 31 peak of $196.45. The company sells mainly discretionary products, and right now “consumers are still being pinched” and thinking more carefully about where they spend their money, according to Matt Stucky, senior portfolio manager for equities at Northwestern Mutual Wealth Management.
Read the full article here