
Shares of both Tesla Inc. and Netflix Inc. fell into correction territory Friday, and their charts suggest the selloffs are likely to continue for as long as several weeks.
Tesla’s
TSLA,
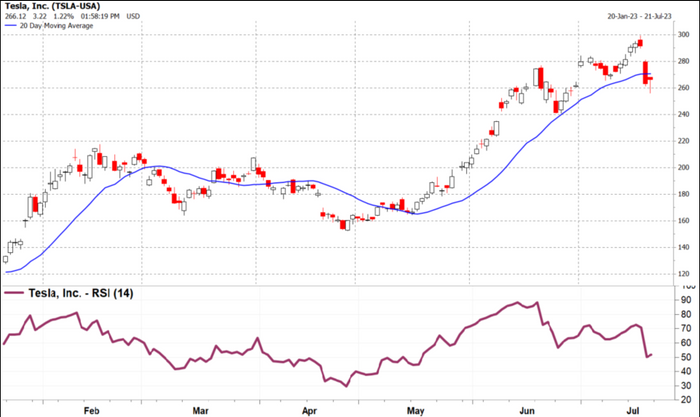
stock fell 1.1% to close Friday at $260.02, which was 11.4% below the 10-month closing high of $293.34 on July 18. Read more about Tesla earnings.
Meanwhile, Netflix
NFLX,
shares shed 2.3% to $427.50 on Friday, or 10.5% below the 18-month closing high of $477.59 on July 19. Read about how Netflix earnings disappointed.
Many on Wall Street call a decline of up to 10% from a significant peak a pullback, while a selloff of 10% to 20% is defined as a correction. Falling 20% or more would make it a bear market.
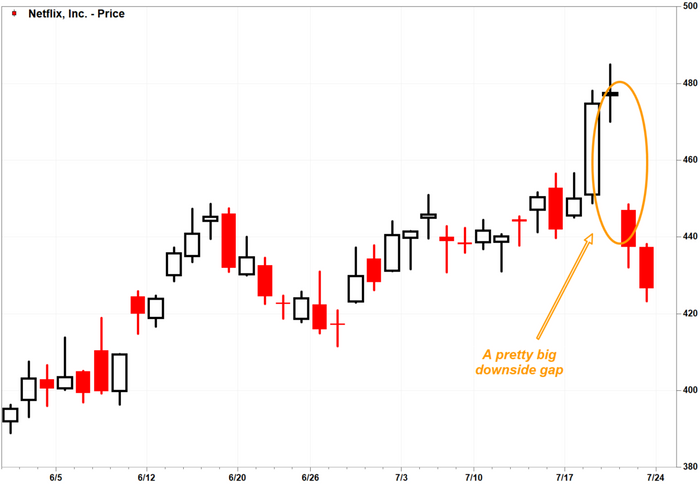
Investors behaved like they were stunned by the two companies’ late-Wednesday earnings reports, as evidenced by the downside gaps in the stocks’ charts on Thursday. A gap decline refers to when a stock’s open is below the previous session’s close.
On Thursday, Tesla’s stock opened at $279.56, below Wednesday’s close of $291.26.
Netflix shares created a gap between Thursday’s open of $447.00 and Wednesday’s close of $477.59.
The downside gaps in the stocks — at a time when their 20-day moving averages, which are used to track shorter-term trends, were flattening out — are “signs of upside exhaustion,” said Katie Stockton, technical analyst and founder of Fairlead Strategies LLC.
“In this environment, we feel that is enough of an indication to reduce exposure temporarily, noting that our indicators now support several weeks of corrective action for both stocks,” Stockton wrote in a note to clients.
Another sign of technical exhaustion is that while the stocks were trending higher in the past month to reach fresh peaks, the relative strength indexes (RSIs) of both stocks had already peaked at overbought levels in mid-June and have been trending lower since.
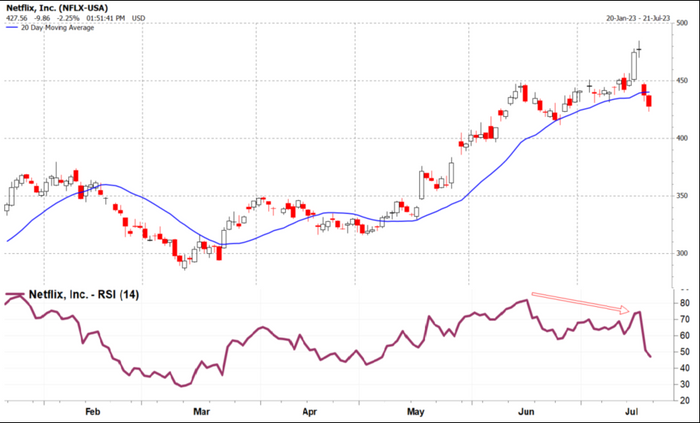
The RSI is a momentum indicator that tracks the magnitude of recent gains against the magnitude of recent losses. When the RSI rises above the 70 level, it’s believed to depict an “overbought” condition, meaning that historically, rallies of that magnitude have tended to tire out the bulls.
Overbought conditions aren’t necessarily good market-timing signals, since they can persist for relatively long periods of time. But when the RSI trends in the opposite direction of price, a technical condition referred to as “bearish divergence,” the RSI direction is often the correct one.
Read: Nvidia’s stock is the most overbought in 18 months, but that doesn’t mean the rally is over
If Tesla’s stock does continue its descent, Stockton said initial support is around the $243 level. For Netflix shares, initial support is around $406.
Other downside levels to watch for in Tesla’s stock is where the widely followed 50-day moving average comes in, currently at $235.31, followed by the early-June breakout level defined by the February peak around $215.
For Netflix, the late-May breakout level defined by the late-January/early-February peak in the $270 area could provide support.
Tesla’s stock has run up 57.5% over the past three months and Netflix’s stock has jumped 30.3%, while the S&P 500
SPX,
has advanced 9.8%.
Read the full article here
