Although the US equity markets have been rewarding for investors in 2023 with strong (but narrow) moves in the market averages, the underlying fundamental picture has deteriorated in terms of US companies’ profitability. Some of this has been obscured by a +29% move in the NASDAQ
NDAQ
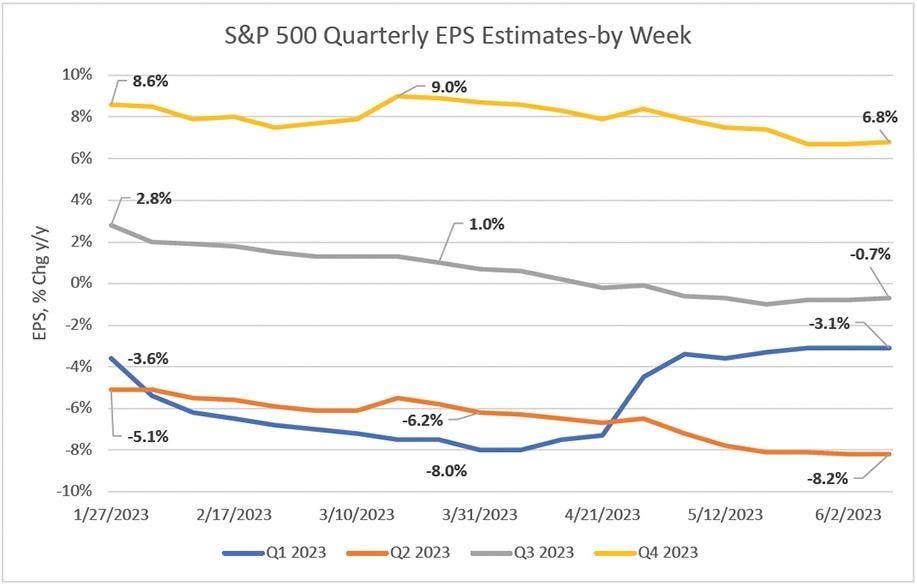
However, while inflation has fallen over the last twelve months from a rate of +1.2% on a month-to-month basis in June 2022 to +0.1% in May 2023, corporate earnings growth has also slowed. Consensus earnings estimates for the next three quarters (Q2-Q4 2023) have continued to come down over the past five months. It is worth noting that this also occurred in Q1 2023, but actual earnings easily outpaced those declining expectations. As seen on the chart below (Figure 1), year-over-year earnings for the S&P 500 are now expected to decline on an absolute basis before bouncing back in the fourth quarter. In addition, earnings expectations for the final three quarters of the year are all lower than they were in early March.
Still, looking at Figure 2, which displays full year 2023 and 2024 earnings estimates, it appears the negative revisions to full-year earnings may be bottoming out.
This stabilization has been accompanied by an increase in individual stock breakouts (Figure 3; also see our Forbes article dated February 23,2023).
If we examine forecasts for median earnings growth at the sector level in Figure 4, we can see that four of 11 sectors have seen their full-year 2023 earnings estimates rise slightly in the last 90 days. Another four sectors have seen their full-year projections stay flat over that time, and only three sectors – Energy, Financial, and Transportation – saw downward revisions. Interestingly, the full-year estimates for the economically sensitive sectors of Basic Material, Capital Equipment, and Consumer Cyclical have all risen. For the overall S&P 500, current 2023 earnings estimates are at the same level as they were 90 days ago, bolstering our confidence that estimates may have bottomed out. Finally, as shown on the second table of Figure 4, all sectors are now forecast to experience earnings growth next year. Using median estimates for 2024 yields a forecast P/E ratio for the S&P 500 of 16x, a typical valuation for the market. While the US stock market is overbought in the short run, this valuation metric, the stabilization of earnings estimates, and the rising number of individual stock breakouts makes us more optimistic about the equity market’s prospects for the next 12 months.
S&P 500 Standouts
In terms of individual names, the below table lists stocks expecting at least 5% sales and 10% EPS growth for Q2 2023 and full-year 2023 and 2024, and trading above 50- and 200-daily moving averages (“DMA”) currently. For investors, we suggest this is a good universe of names to explore for possible new additions to a portfolio.
Meanwhile, we are tracking several additional names from two categories.
1) Those setting up well technically far in advance of a resumption in earnings growth. We have focused on those with negative Q2 2023 and full-year 2023 sales and EPS estimates, but positive 2024 sales and EPS estimates (+5% and 10% respectively).
2) Stocks not set up particularly well technically, but with sales and EPS growth of at least 5% and 10% respectively for Q2, 2023, and 2024. These are either below 50-DMA, below 200-DMA, or both, and have Relative Strength (“RS”) Ratings below 75.
Kenley Scott, Director, Global Sector Strategist at William O’Neil + Company, an affiliate of O’Neil Global Advisors, made significant contributions to the data compilation, analysis, and writing for this article.
Disclosures
O’Neil Global Advisors, Inc. (OGA) is an SEC Registered Investment Advisor. Under no circumstances should any information presented in this report be construed as an offer to sell, or solicitation of any offer to purchase, any securities or other investments. Our content and stock charts, which provide certain current and historical information, should not be relied upon as the sole factor in determining whether to buy, sell, or hold a stock. The charts are not a substitute for a comprehensive analysis of the individual stocks. The past performance of any investment strategy or stock discussed in this report should not be viewed as an indication or guarantee of future performance. Nothing contained herein constitutes financial, legal, tax or other advice, nor should any investment or any other decision(s) be made solely on the information set out herein.
© 2023, O’Neil Global Advisors Inc. All Rights Reserved. No part of this material may be copied or duplicated in any form by any means or redistributed without the prior written consent of OGA.
Read the full article here
