This week’s Fed meeting is extraordinary, and it could shock investors in a way we haven’t seen since 2008.
So, I’m doing the weekly economic update at the start of the week to help you stay calm and prepare for a highly volatile week.
What Makes This Fed Meeting The Most Unique Since 2008?
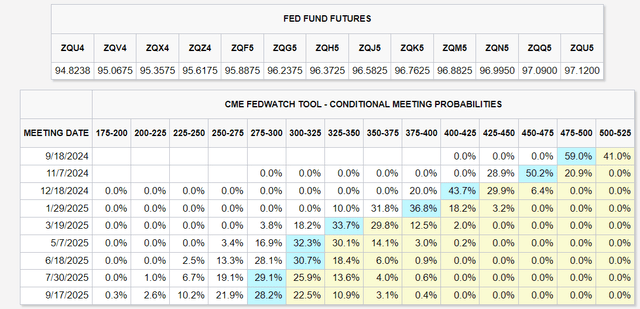
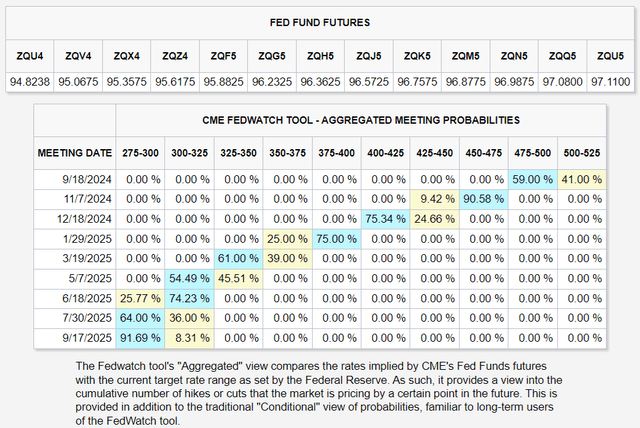
Suppose you’ve long viewed financial media like Fox Business, CNBC, Bloomberg, or reputable YouTube channels like Charlie Bilello and The Compound. In that case, you might have seen these tables frequently in recent years.
CME Group
CME Group
These estimates come from Fed fund futures, options that trade billions in daily volume that financial institutions use to hedge interest rate risk.
These permit us to see real-time estimates by the bond market of what the Fed will do in the future.
This meeting is so incredible that since 2008, the Fed has always followed the 80%-plus consensus probability.
In other words, for the last 16 years, going into the Fed meeting (which runs Tuesday and Wednesday), the Fed futures were always pricing in an 80%-plus probability, and the Fed has always delivered what the bond market expected.
That’s because the Fed uses “forward guidance,” courtesy of its official “Summary of Economic Projections,”, to guarantee that the bond market is never surprised.
It’s not just stability the Fed is after – by signaling what the Fed is planning in the future, the bond market begins changing interest rates months, sometimes years before the Fed has to start changing interest rates.
The Fed only has three tools at its disposal:
- Fed Funds Rate (short-term rates).
- Its Balance Sheet (QT, QE, special programs like during the Financial Crisis and Regional banking crisis, Pandemic).
- Forward Guidance (Fed Talk and projections).
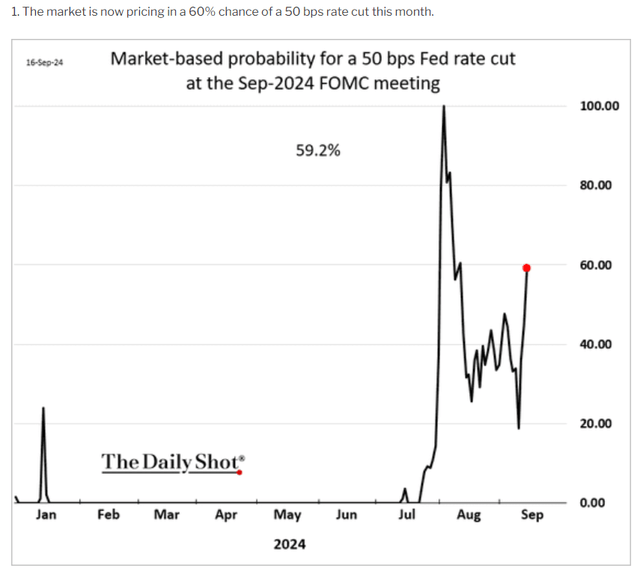
According to Bloomberg Surveillance, this is the first meeting since 2008 in which the Fed futures have not been at 80%-plus to start the week.
Daily Shot
Last week, after the inflation reports came in as expected, the bond market was signaling a 20% chance of a 0.25% first cut, but now we have a 59% probability of a 0.5% cut.
- Former Fed President Bill Dudley did a very hawkish speech on Friday.

Daily Shot
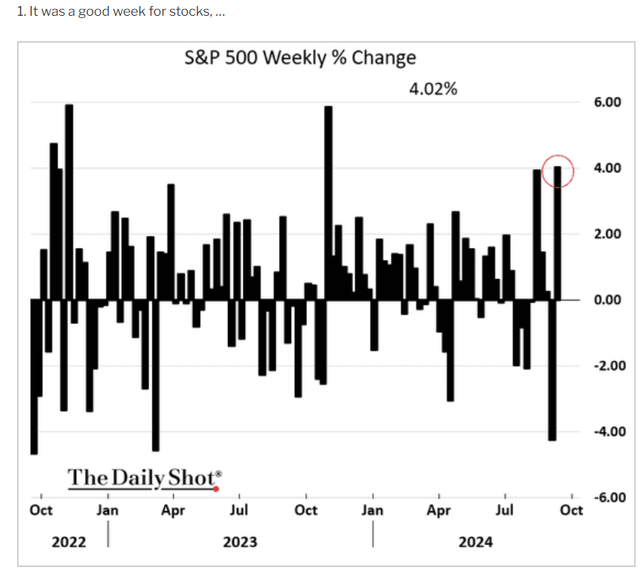
The market was up five straight days last week, including an incredible 6% rally for tech stocks, on optimism that the Fed will cut 0.5% and signal more big cuts coming.
Daily Shot
Stocks saw the best week in a year, following the worst week in 18 months.
- Volatility clusters.
- 80% of the best days are within two weeks of the worst days.
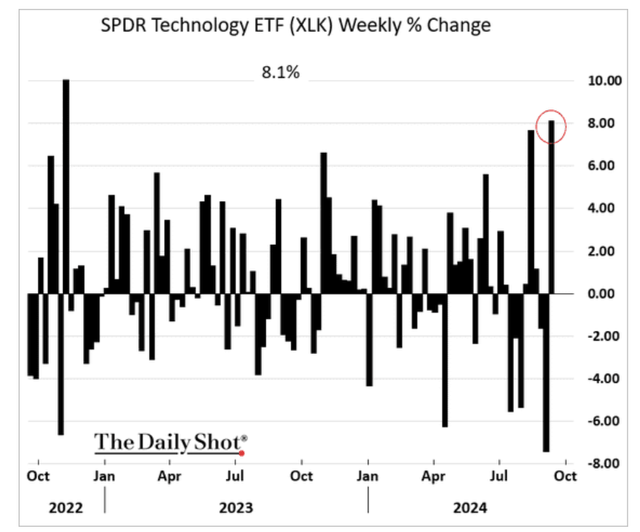
Daily Shot
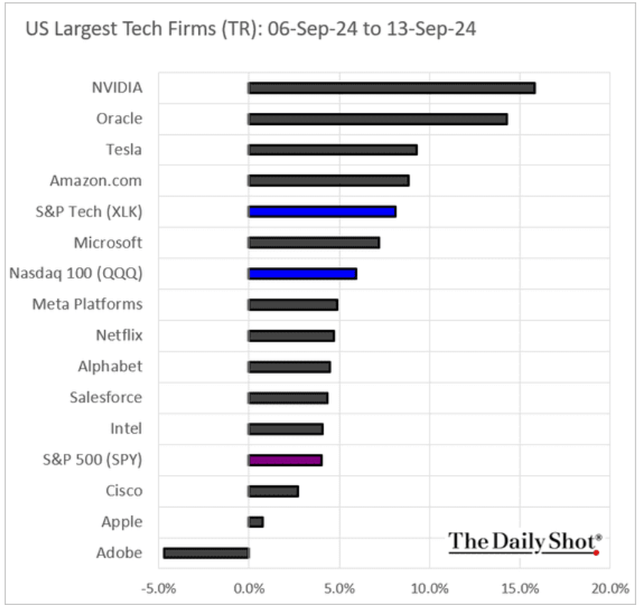
Daily Shot
Volatility cuts both ways. The joys of significant gains require big short-term losses at times.
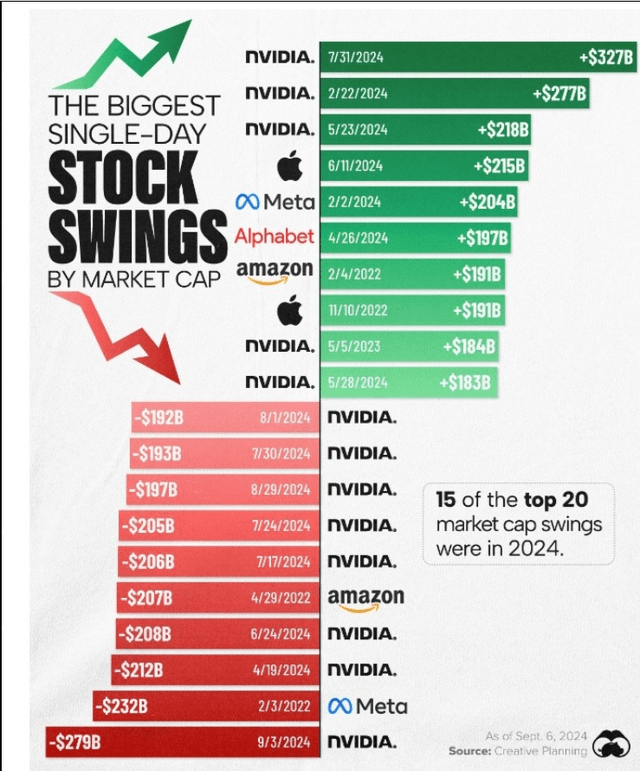
Visual capitalist
A surprise 50 basis point cut could trigger extreme stock market volatility from Wednesday to Friday, so I wanted to showcase what the Fed weighs in its decision and, most importantly, what investors need to know.
Why The Fed Is Considering A 0.5% Cut This Week

FactSet Research Terminal
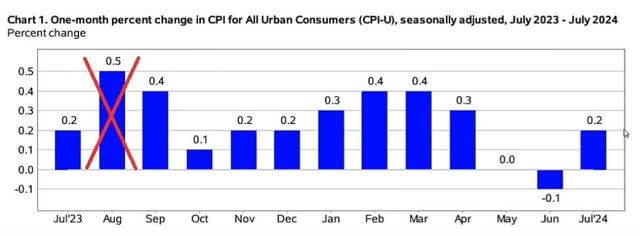
Inflation came in slightly below expectations, with core CPI at 3.2%, but headline inflation was 2.5% vs. 2.6% expected and 2.9% last month.
Charlie Bilello
Inflation is calculated by removing the last month of the previous 12 and replacing it with the newest month-over-month estimate.
This month, 0.5% dropped from last August and was replaced with 0.2%, thus causing the headline rate to decline by 0.4%.
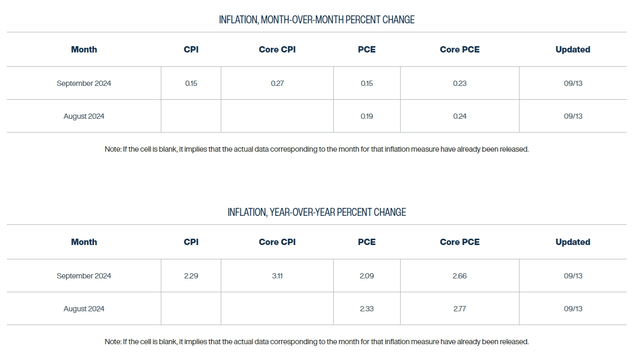
According to the Cleveland Fed’s real-time inflation model, it will drop 0.4% from last September and replace it with just 0.15% next month.
Cleveland Fed Real-Time Inflation Nowcast
Charlie Bilello
That means a headline inflation rate of 2.3% but, more importantly, an annualized inflation rate of 1.8%.
In other words, if the 0.15% month-over-month rate holds for a year, headline inflation will be 1.8% next year.
- CPI is on track to bottom at 1.4% in April 2025 if 0.15% monthly inflation continues.
CPI historically runs 0.5% ahead of core PCE, the Fed’s official inflation metric.
Core PCE is the personal consumption expenditure index and considers substitution effects.
For example, if beef prices are higher, but chicken prices aren’t, consumers tend to cut back on beef and buy more chicken.
Substitution is why the PCE index is usually lower than the CPI, and the Fed uses Core PCE as its official inflation metric.
The core is “ex-food and fuel,” which smooths out inflation over time.
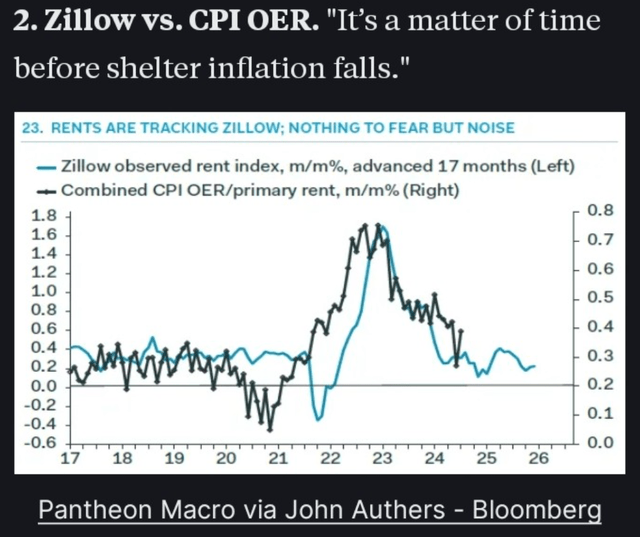
Currently, Core PCE is higher than CPI because of owner-equivalent rent or OER.
It’s how the government officially measures rent, though it’s a fundamentally flawed 12-month lagging indicator.
DailyChartBook
In the 1990s, the government began measuring Owner-Equivalent Rent by surveying homeowners and asking, “What do you think you could rent your house for?”
Today, we have Redfin and Zillow real-time rental data based on millions of properties.
But the Bureau of Labor Statistics doesn’t want to change how it measures inflation when inflation is high lest it look like “The government is moving the goalposts to fake the numbers!”
But the point is this.
If current inflation trends hold within 12 months, inflation will be 1.8%, and core PCE will be just 1.3%.
That’s 0.7% below the Fed’s target.
Truflation
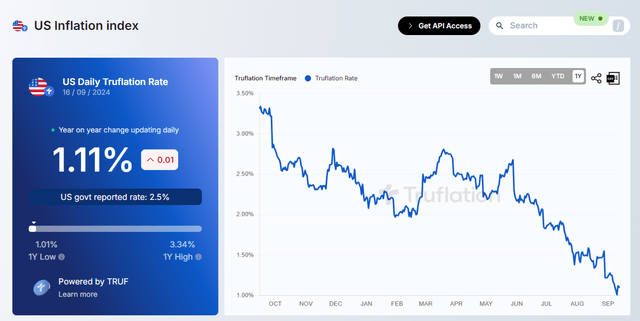
Truflation is a private measure of real-time inflation that estimates it using 10 million daily prices. Since 2012, it has been 97% correlated with CPI and is an excellent leading indicator of where inflation will go if current trends hold.
Truflation peaked at 11.6% in June 2022 (CPI peaked at 9.2%), indicating that the government underestimated actual inflation.
Today, the government overestimates inflation because 33% to 40% of CPI and core CPI are owner-equivalent rent, showing over 5% housing inflation.
The most helpful thing about Truflation is that it can tell us a reasonable estimate of several key metrics.
Atlanta Fed
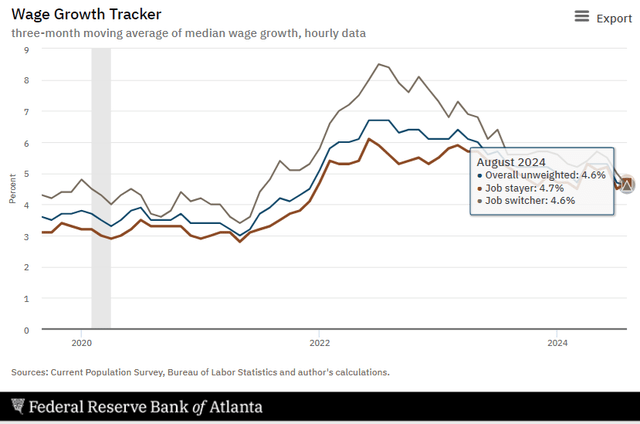
The Fed surveys 130,000 households monthly and tracks wage growth over time.
The Fed wage growth tracker is the gold standard of wage growth because it involves the same people rather than monthly surveys of different people.
What’s notable about wage growth is that, for the first time in years, job switcher wages are growing slower than job stayers’ wages.
In other words, those taking risks, quitting their jobs, and getting a new job with another company are now getting lower wages.
That’s a sign of a cooling job market, but 4.6% wage growth is still robust, especially compared to 1.1% real-time inflation.
- 3.5% inflation-adjusted real-time wage growth is about 2X the historical norm.
Truflation is also a good proxy for where the Fed funds rate should be within 12 months based on economic data.
- 1.1% CPI in 12 months (if current inflation trends hold).
- 0.6% core PCE in 12 months (growth scare).
- Fed cuts rates from 1% to 1.25% to stimulate the economy.
In other words, if we look at the summary inflation data, we can see signs of economic weakness, which is why, on Friday afternoon, former Fed President Bill Dudley said he would vote for a 0.5% cut (if he were still at the Fed).
Why This Could Turbocharge Stock Volatility This Week
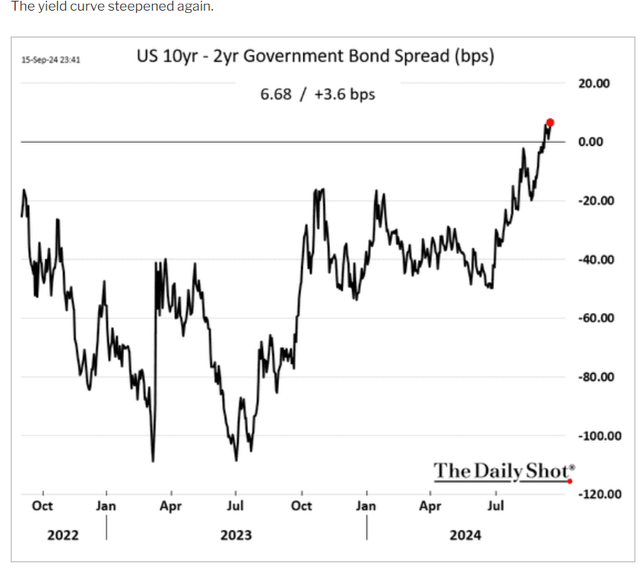
Daily Shot
The yield curve (10-year Treasury minus two-year Treasury yield) was uninverted last week, signaling many scary headlines about an imminent recession.
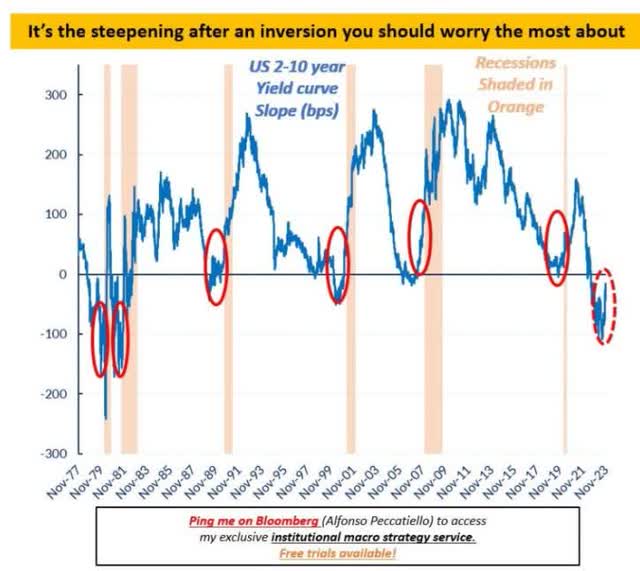
Bloomberg
While yield curve inversion signals recession is coming at some point, uninversion has historically signaled that recession is here.
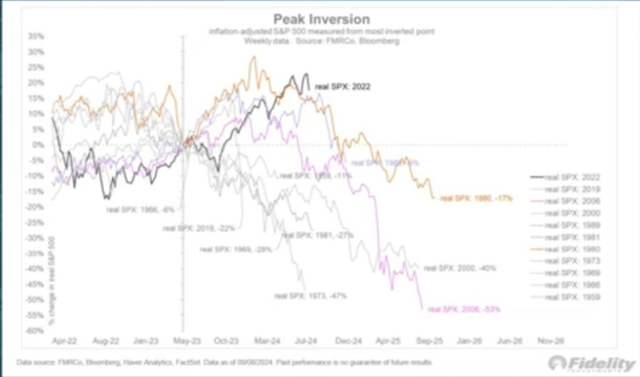
Compound
Thus, some bears point to charts like this one, which clearly shows that a steepening of the yield curve (after peak inversion) signals terrible times ahead for stocks.
Not So Fast. Context Makes All The Difference
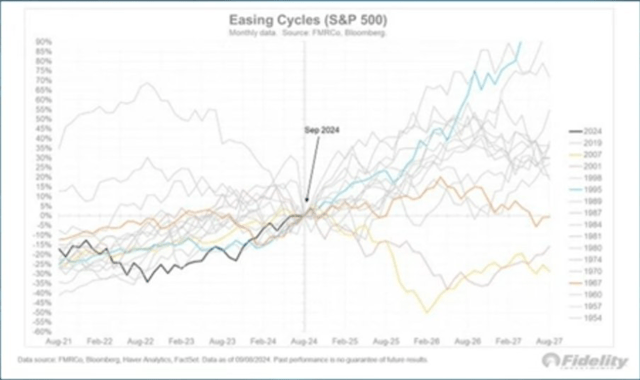
Compound
In every cutting cycle since 1954, stocks have increased in the following three years, with two exceptions.
- 2000-2002: Biggest Stock Market Bubble In History, 9/11, Recession, Accounting Scandals (Worldcom, Enron).
- The Great Recession Was The Worst financial crisis since the Great Depression.
As Jurrien Timmer of Fidelity told Joshua Brown and Michael Batnick in last week’s Compound and Friends, this time might be different because the banking yield curve didn’t invert.
Usually, a yield curve inversion means banks must raise their interest rates on checking and savings accounts, which contracts their net interest margins.
When banking is less profitable, banks lend less, and that’s why yield curve inversions have historically signaled recessions about two years later.
However, as Fidelity points out, big banks’ cost of borrowing (average deposit rate) is just 0.5%, even though the Fed hiked 5.25%.
Regional banks had to raise rates, especially on high-yield savings, but big banks like JPMorgan (JPM), Bank of America (BAC), Citigroup (C), and Wells Fargo (WFC) mainly fund from low-yielding checking.
Thanks to the pandemic stimulus and the most robust economy since 1962, big banks never saw their yield curve invert.
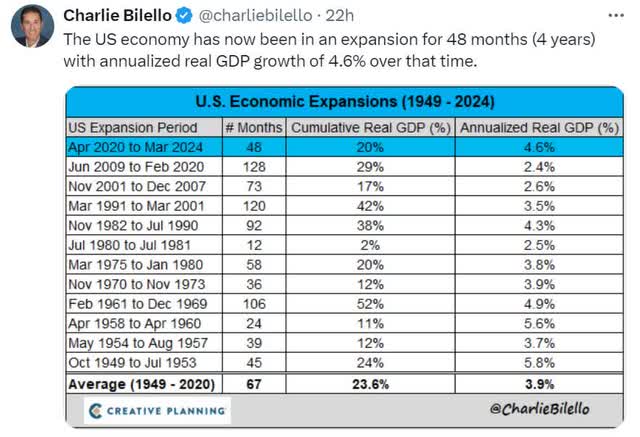
Charlie Bilello
Big banks never stopped lending; Bank of America, the No. 1 lender to small businesses, accelerated lending.
Thus, the economy has been so strong because banks never pulled back on lending because their profitability never declined. Bank loan default rates never rose above pre-pandemic levels.
What about rising unemployment? Didn’t the Sahm Rule trigger recently?
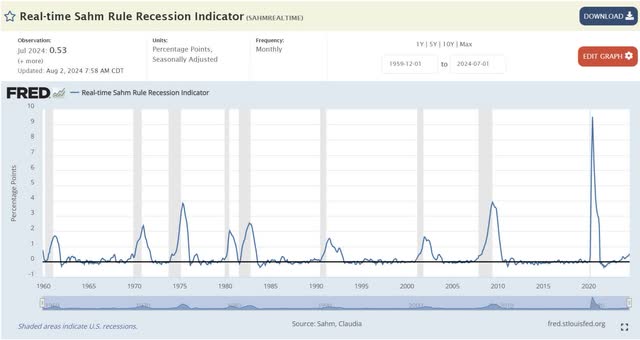
St. Louis Fed
Yes, it did. This rule has never been wrong since the 1960s. It states that if three-month rolling unemployment rises 0.5% above the 12-month low, the economy is in recession, and the Fed should immediately begin economic stimulation.
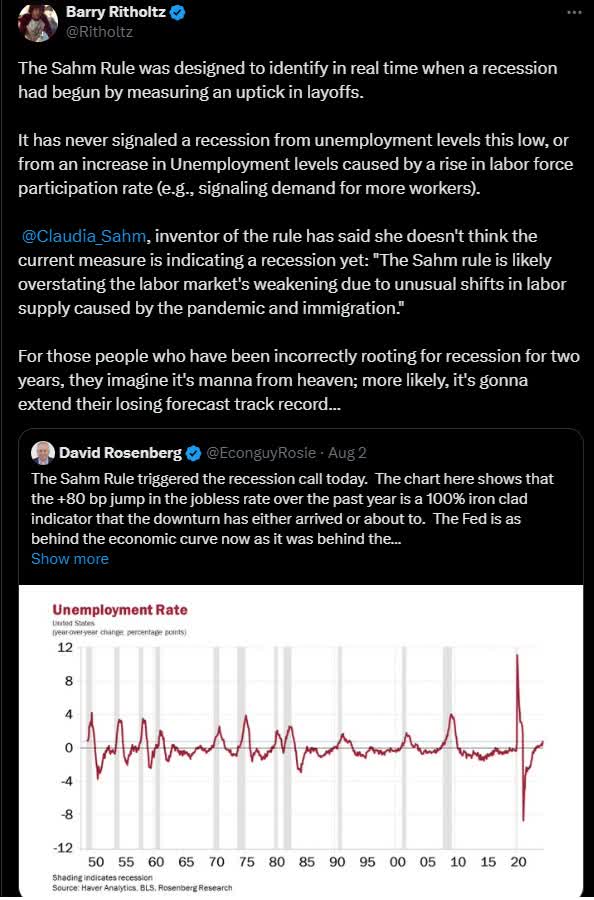
Ritholtz Wealth Management
No less than Claudia Sahm herself, who created the Sahm rule, says that unemployment is going up because of an unprecedented increase in the labor market, which means the rule is likely wrong this time, for the first time.
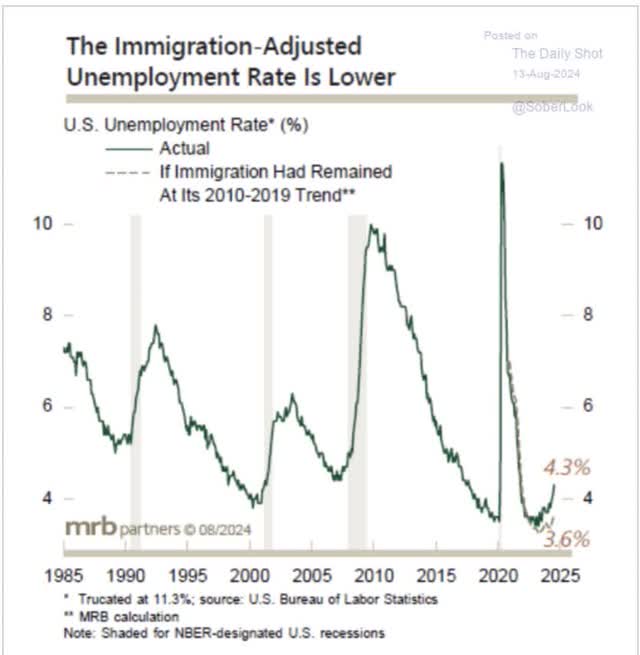
Daily Shot
According to the Wall Street Journal and Bloomberg Intelligence, 9 million immigrants in the last three years, 75% of whom are now working, have caused a much stronger job market than economists expected and are the primary reason we avoided the 2023 recession that 100% of economists had been expecting.
Today’s immigration-adjusted unemployment rate is 3.5%, which means unemployment is 0.2% above its lows and not close to signaling a recession.
For context, 9 million immigrants, a backlog created by the pandemic lockdown of immigration to virtually zero for several years is equal to the immigration of the previous 10 years.
- Due to the Pandemic, we had a 3.33X surge in immigrants, which generated robust job growth and prevented a recession in 2023.
In other words, the pandemic was unprecedented, resulting in $9 trillion in stimulus, supply chain disruptions, workforce disruptions, immigration disruptions, and the breakdown of many economic models.
But wait a second: If the Fed is likely to cut 0.5% this week (this could still change), is that good or bad for stocks?
Will the market think, “The Fed is panic cutting because the recession is around the corner” or “The Fed is declaring victory and doing a major celebratory cut?”
Small caps are both interest rate sensitive (42% floating rate debt) and the most economically sensitive.
So even “the market of stocks, not the stock market,” might become chaotic later this week.
Fighting Fear With Facts: Let’s Look At The Data
Compound
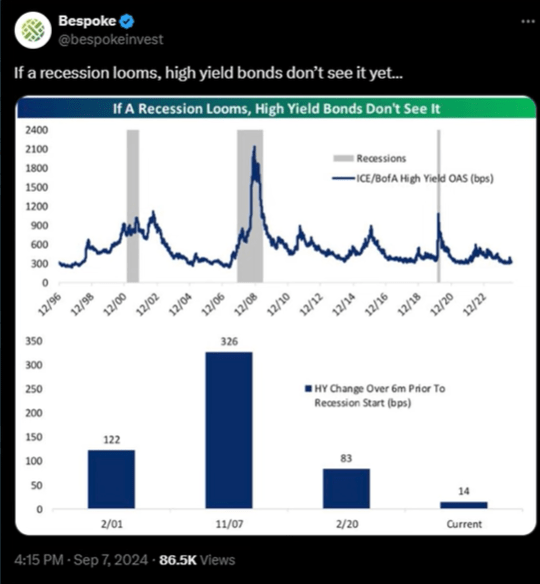
Junk bond spreads (yield vs. 10-year yield) are an excellent proxy for financial stress.
In recessions, junk bond-rated companies tend to default more, and investors demand much higher risk premiums over risk-free government bonds to buy junk bonds.
For example:
- 2000 recession: 14% junk bond yields.
- 2008 Financial Crisis: 23% junk bond yields.
- Pandemic: 9% junk bond yields (up from a record low of 4.5%).
Today, junk bonds are spreading, signaling little fear about a recession.
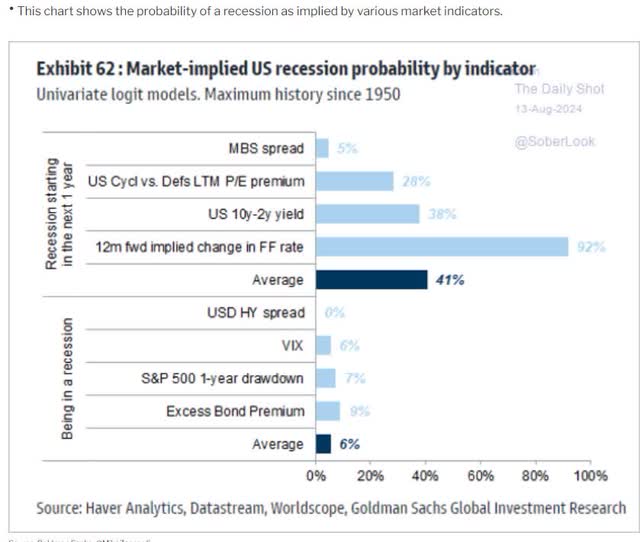
Daily Shot
As the Sahm Rule says, the junk bond market signals a 0% probability that the economy is in a recession.
- Immigration adjusted Sahm Rule doesn’t.
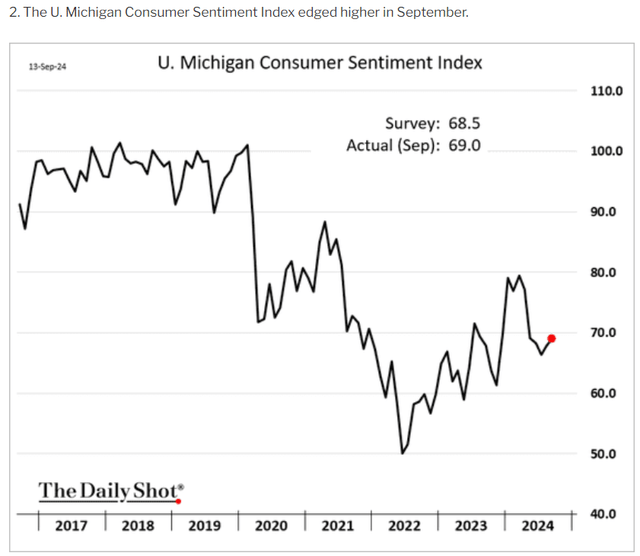
Inflation Rules Consumer Confidence Right Now
Daily Shot
Consumer Confidence started falling when inflation picked up. It bottomed at peak inflation in June 2022 and has been steadily trending higher as inflation has been falling.
- Inflation Is On Track to Bottom in April 2025.
- Consumer Confidence Will likely peak in May 2025.
- Higher confidence = higher spending = less risk of recession.
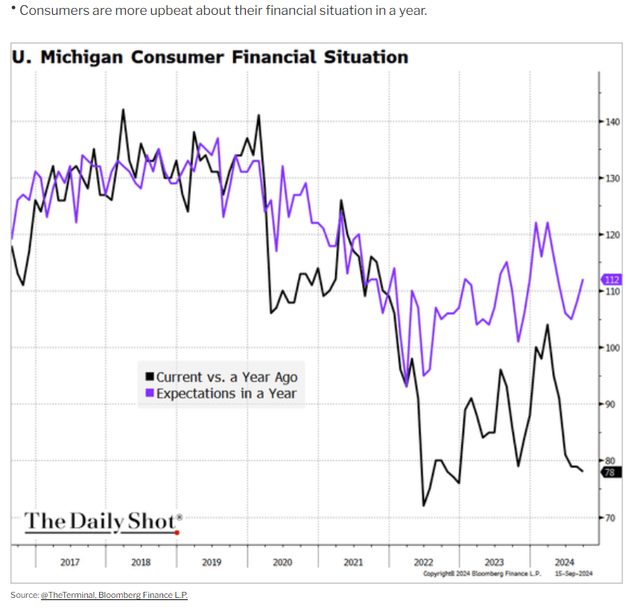
Daily Shot
Consumers are increasingly optimistic about their finances in a year.
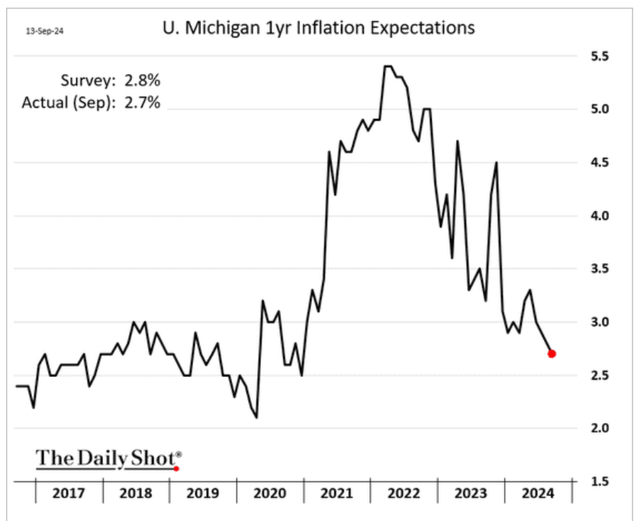
Inflation is the reason for the “vibe session.” After 20 years of meager inflation, the worst inflation in 42 years was such a shock that most Americans felt like the economy was in recession.
Daily Shot
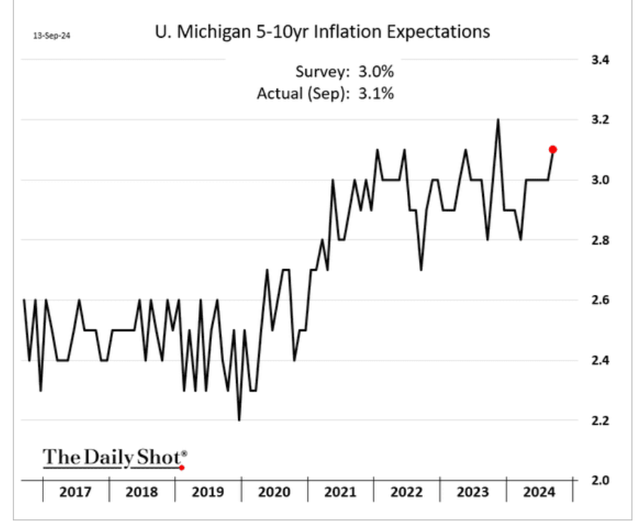
Consumer expectations for future inflation track inflation with a lag.
Daily Shot
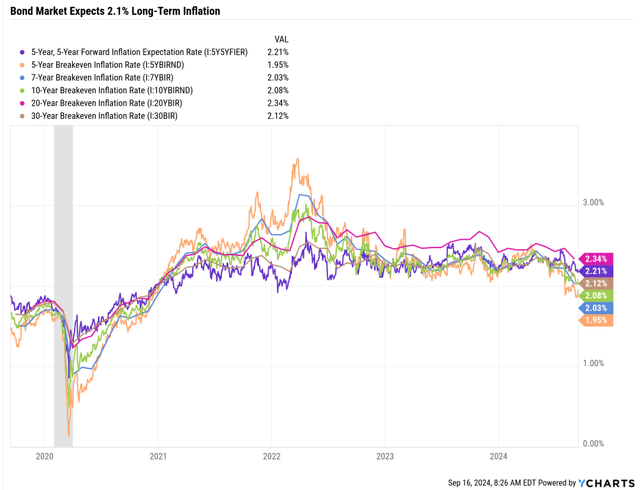
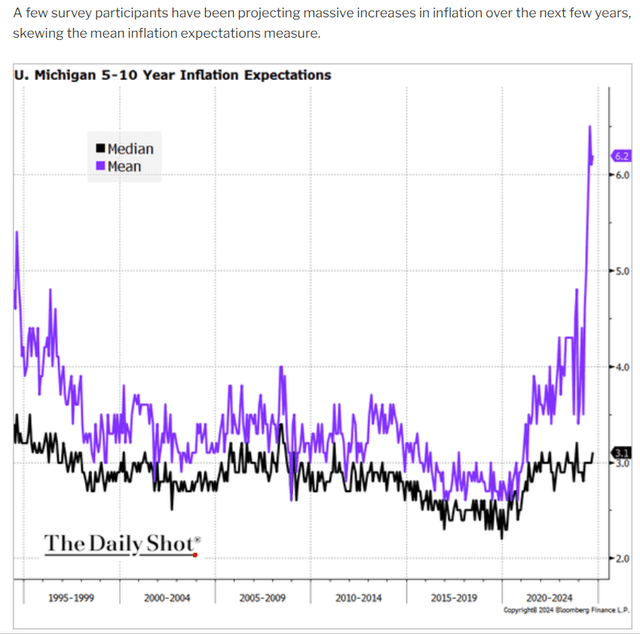
Inflation is not likely to be 3.1% long term, barring unexpected shocks, such as significantly higher tariffs.
Ycharts
The bond market is now pricing in 2.1% inflation over the next 30 years, 1% lower than consumers expect.
Daily Shot
- Potential for positive surprises to delight consumers, increase confidence, and strengthen consumer spending in the future.
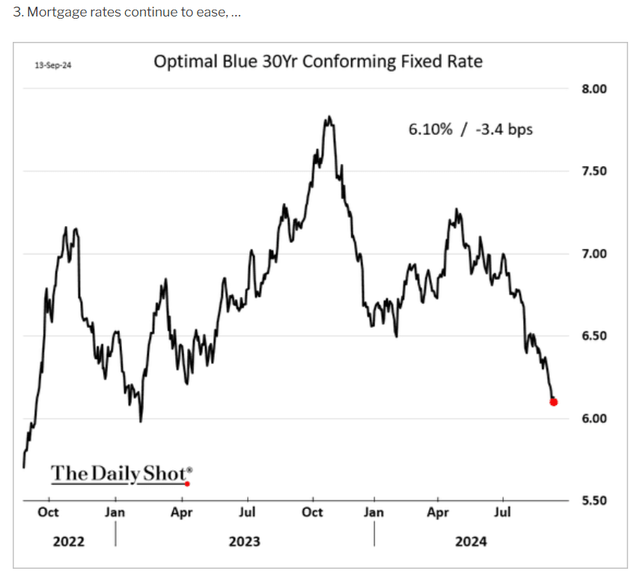
Daily Shot
- The long-term average mortgage rate (FactSet consensus): 5.9%.
But isn’t it true that you can cherry-pick metrics and statistics to make them say anything you want?
Weekly Real-Time Recession Watch
Here are the nine real-time indicators we now have to track the economy.
- Atlanta Fed GDPNow.
- New York Fed GDPNowcast.
- St. Louis Fed GDPNowcast.
- NY Fed’s Weekly Economic Index.
- Baseline and Rate of Change Economic Grid.
- Silver Bulletin Economic Index.
- St Louis Fed Financial Stress Index.
- Kansas City Fed Financial Stress Index.
- Chicago Fed National Financial Condition Index.
Collectively, these ten models ensure that if the economy is rapidly weakening, we’ll see it in the data.
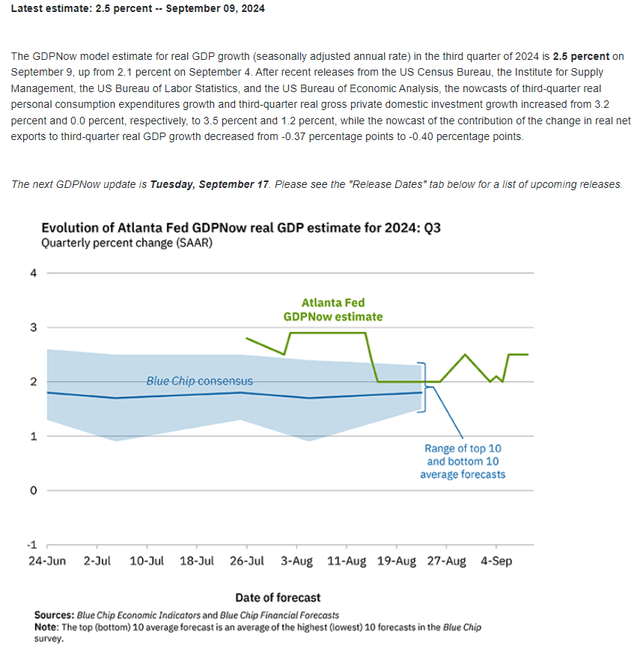
Atlanta Fed GDPNow: 2.5% GDP
Atlanta Fed
The economist consensus is for 1.8% growth, a “no landing” scenario. The Atlanta Fed estimates growth has slowed from 3% to 2.5%.
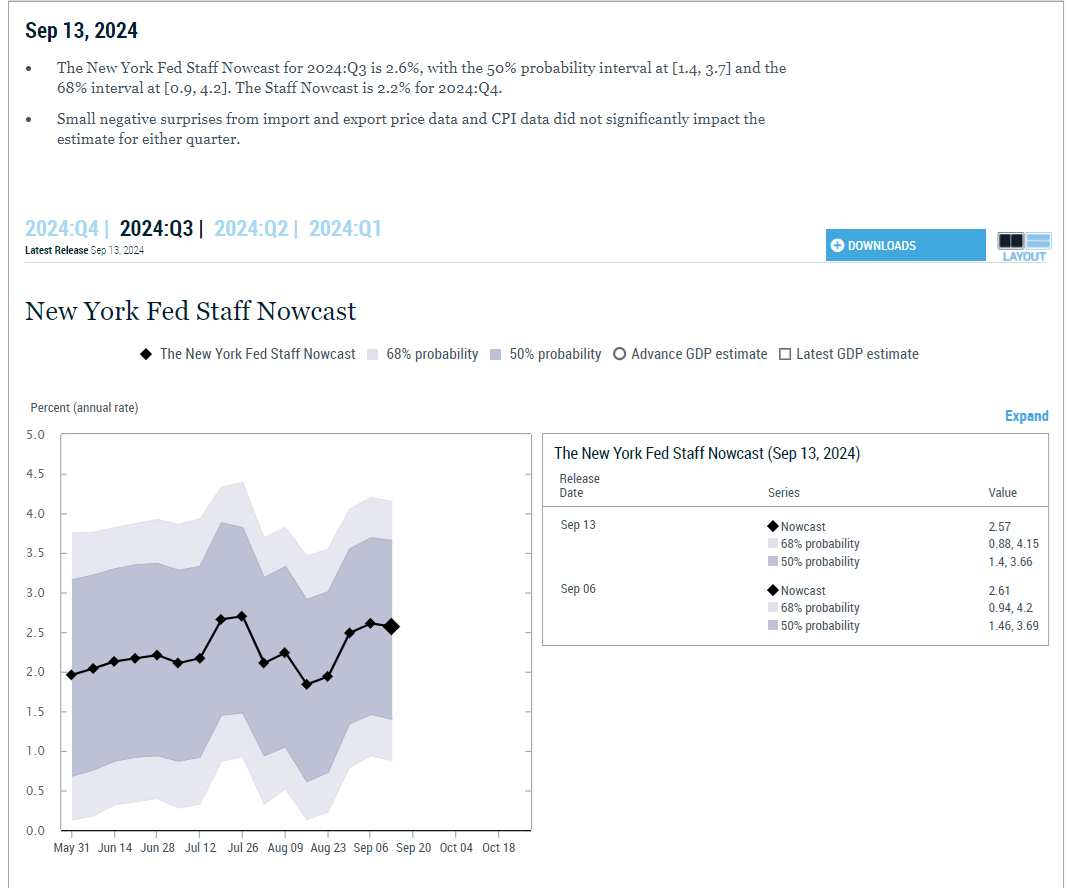
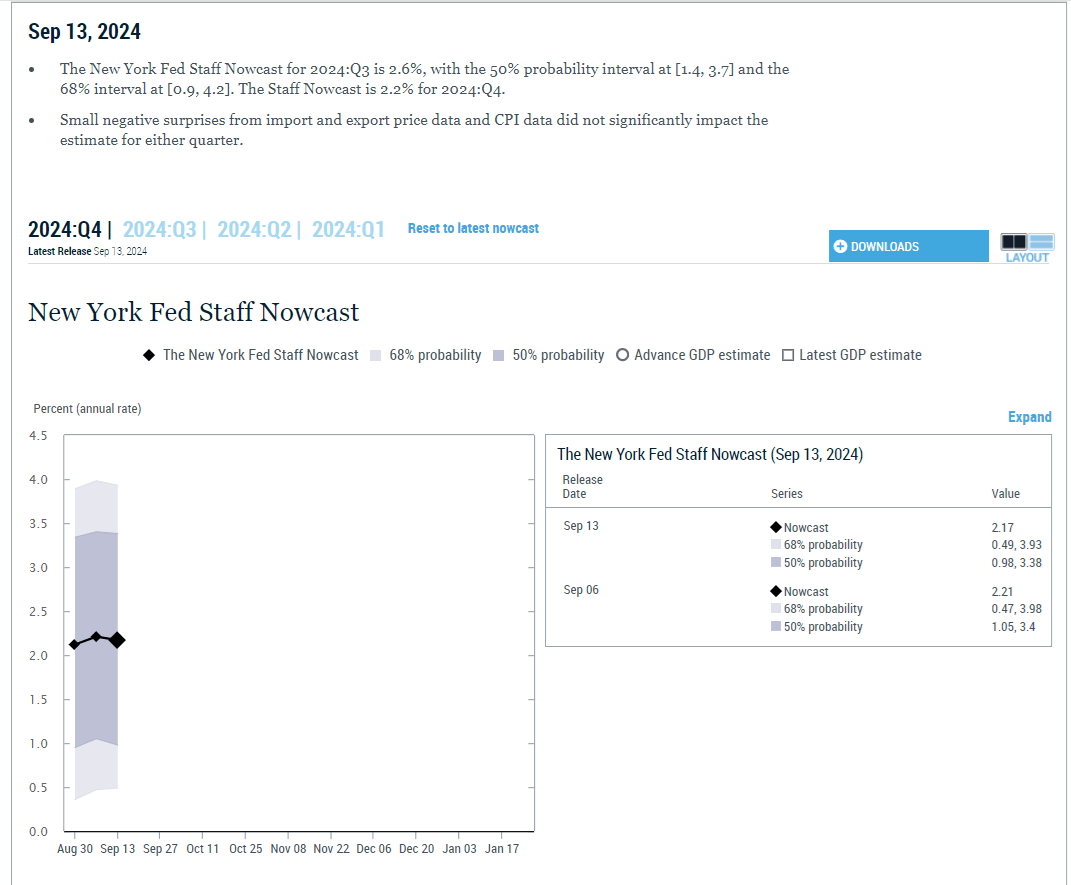
New York Fed GDPNowcast: 2.6% GDP Slowing To 2.2% In Q4
NY Fed
NY Fed
The New York Fed thinks the economy will slow to 2.2%, down from 2.6% to 3% last quarter, and then accelerate again.
It’s a no-landing scenario.
Stocks do well above 2% GDP growth. Sub 2%, and you get growth scares. 2+% growth + steady rate cuts = unprecedented tailwinds for stocks.
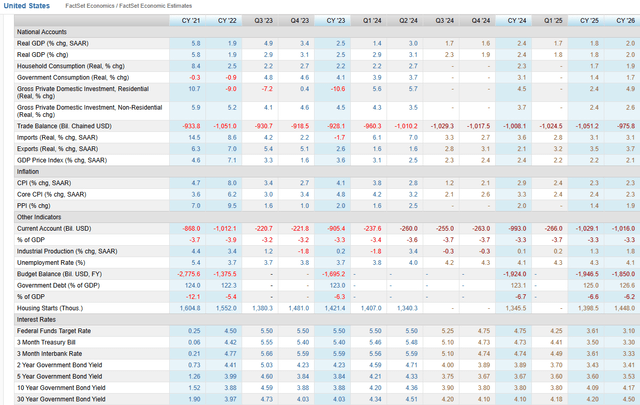
FactSet
The FactSet consensus expects growth to slow next quarter, bottoming at 1.6%, followed by slight acceleration in Q1 2025 and beyond.
St. Louis Fed GDPNowcast: 1.6% Growth
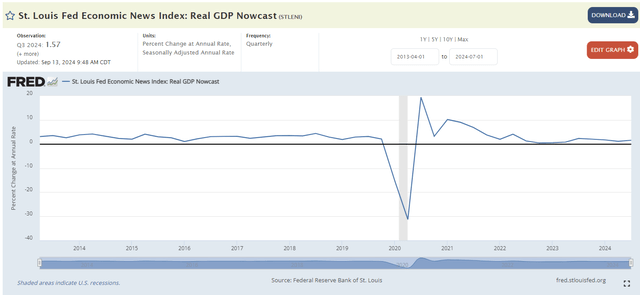
St. Lois Fed
The St. Louis Fed agrees with the FactSet consensus that growth is 1.6% and thus represents a “soft landing” with a slight slowdown below 1.8% average growth, followed by acceleration starting next year.
Dallas Fed’s Weekly Economic Index
The WEI indexes actual economic activity using timely and relevant high-frequency data.
It represents the common component of ten daily and weekly series covering consumer behavior, the labor market, and production.
The WEI scales to the four-quarter GDP growth rate. For example, if the WEI reads -2% and the current level persists for an entire quarter, one would expect, on average, GDP that quarter to be 2% lower than a year previously.
The WEI is a composite of 10 weekly economic indicators:
- Redbook same-store sales.
- Rasmussen Consumer Index.
- New claims for unemployment insurance.
- Continued claims for unemployment insurance.
- Adjusted income/employment tax withholdings (from Booth Financial Consulting).
- Railroad traffic originated (from the Association of American Railroads), the American Staffing Association Staffing Index.
- Steel production.
- Wholesale sales of gasoline, diesel, and jet fuel.
- Weekly average US electricity load (with remaining data supplied by Haver Analytics).
- All series are year-over-year percentage changes. These series combine into a single index of weekly economic activity.” St. Louis Fed.
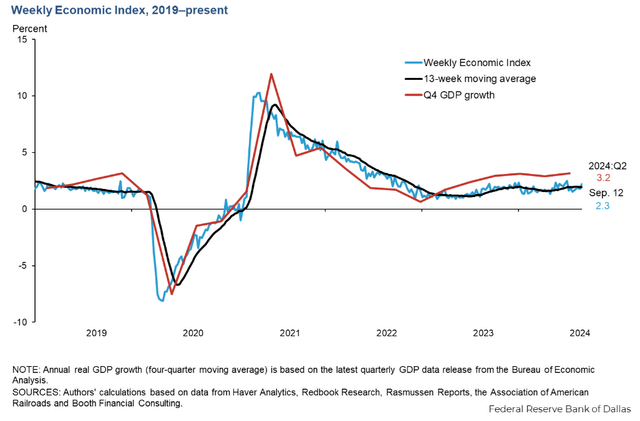
Dallas Fed
The Dallas Fed thinks the final estimates of Q2 growth will be revised up to 3.2% and that the economy is accelerating steadily above the 13-week moving average, potentially reaching 5.5% GDP growth within a year.
That’s very bullish economic data for Main Street and especially Wall Street.
- Potentially 20%-plus EPS growth next year.
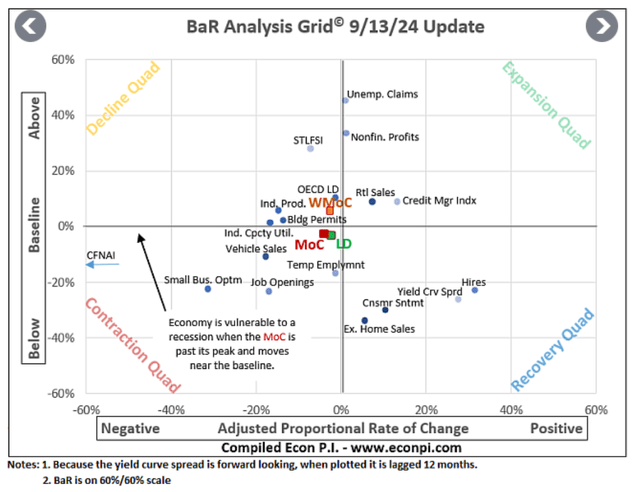
Baseline and Rate of Change Economic Grid
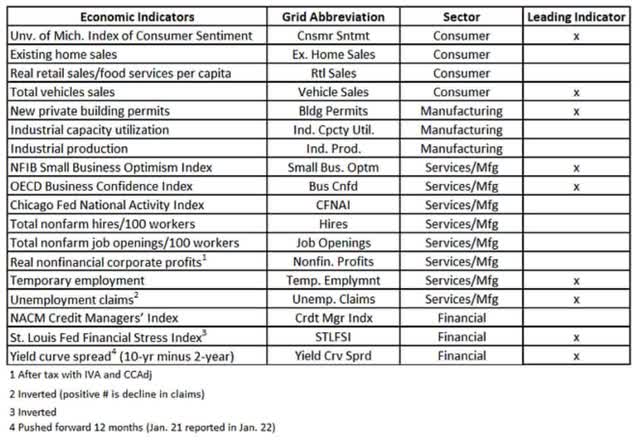
David Rice
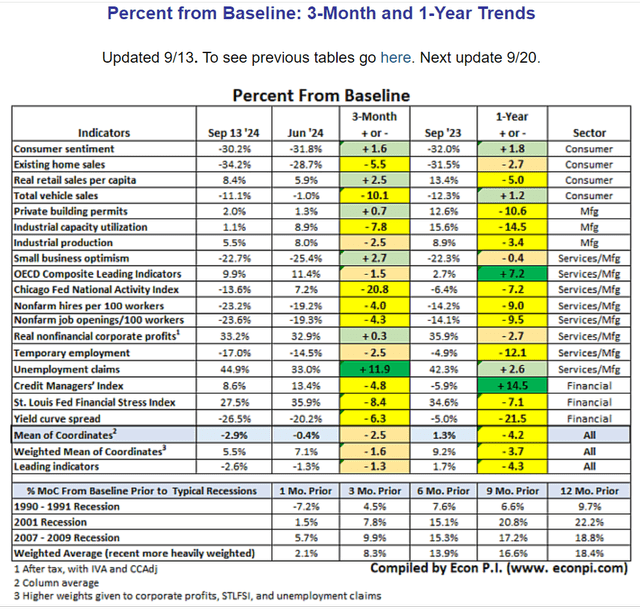
David Rice tracks 19 economic and nine leading indicators and plots them on a grid, showing how far each point is above or below the 30-year baseline (average).
He also plots how fast they are changing from month to month.
This single graph gives us a God’s eye view of the US economy.
David Rice
The orange dot is the weighted average of all indicators and remained above the 30-year baseline, but the month-over-month rate of change is negative.
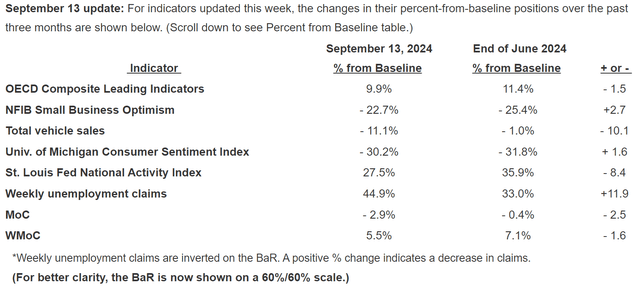
The leading indicators (green dot) are now below trend, and getting worse (it was positive and moving more positive, indicating economic acceleration).
David Rice
The economy has been cooling in the last three months.
David Rice
David Rice
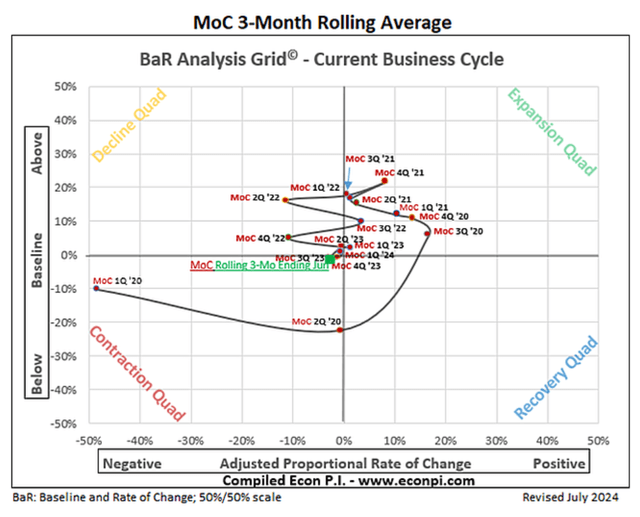
Peak growth (6.9% GDP) occurred in Q4 of 2021, and the fastest rate of economic acceleration occurred in Q3 of 2020 (17% improvement MoM).
Based on this, we can calibrate the following model.
- Each 1% above or below baseline is 23.2 basis points of growth.
- 2.6% below baseline (leading indicators) = -0.616% peak slowdown.
- 1.8% trend growth -0.4% slowdown = 1.2% minimum growth rate (1.4% last week, 1.3% two weeks ago, 1.0% three weeks ago).
- This data points to a soft landing.
- However, there has been a significant deterioration in the last week.
The Bar grid is the first and only model pointing to a sharp economic growth deterioration.
A 1.2% trough GDP growth rate would call into question a soft landing and likely lead to a growth scare that could trigger a 10% to 15% stock market correction.
Silver Bulletin Economic Index
As part of his political forecast, Nate Silver is tracking six historical economic indicators that have affected people’s perceptions of the economy.
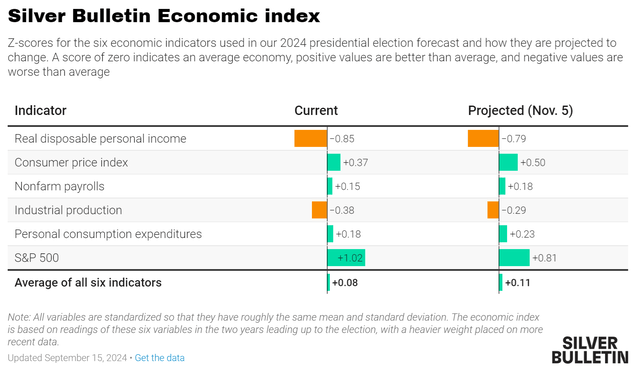
Nate Silver
The economy is running 0.08 standard deviations above the two-year rolling average (the most robust economy since 1962), and the model expects the economy to improve slightly by election day.
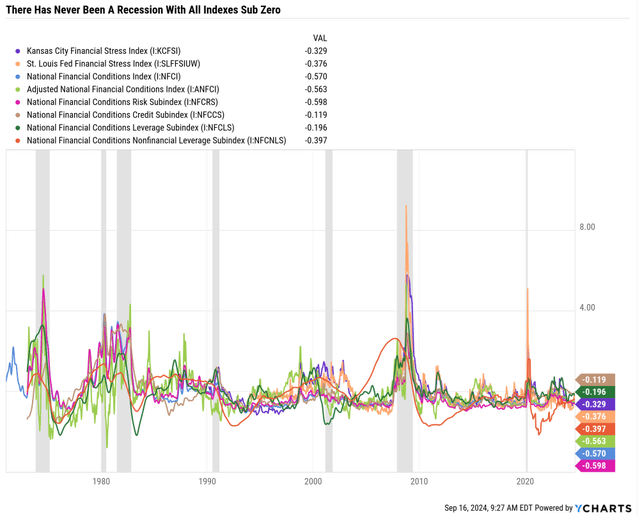
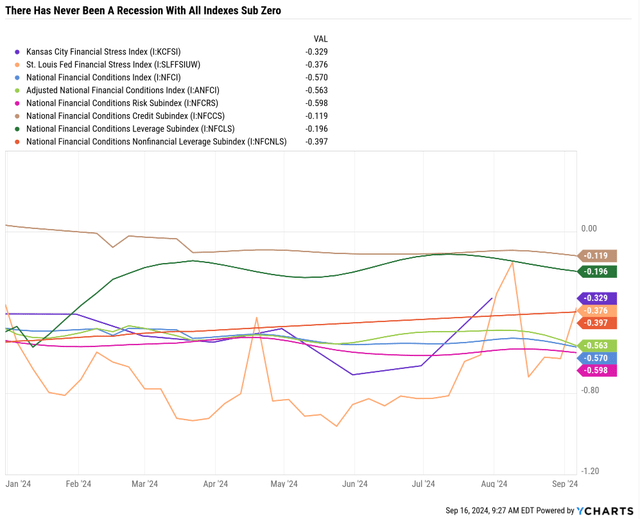
St. Louis/Kansas City/Chicago Fed Financial Stress Index
Zero is the average financial stress since the inception of each index.
Negative numbers indicate below-average financial stress.
Ycharts
Financial stress has gotten better (less financial stress) in recent weeks.
- Two weeks ago, the lowest negative index was -0.07.
- Now -.119.
Ycharts
There is some minor rising financial stress, as seen by the St. Louis Fed index in recent weeks, but we’re still well below the point when recession becomes the base case.
Bottom Line: A Potentially Crazy Week For Stocks Ahead Of A Potentially Shocking Fed Move
For the first time in 16 years, the Fed meeting will start with no overwhelming consensus that will ensure we know what the Fed will do.
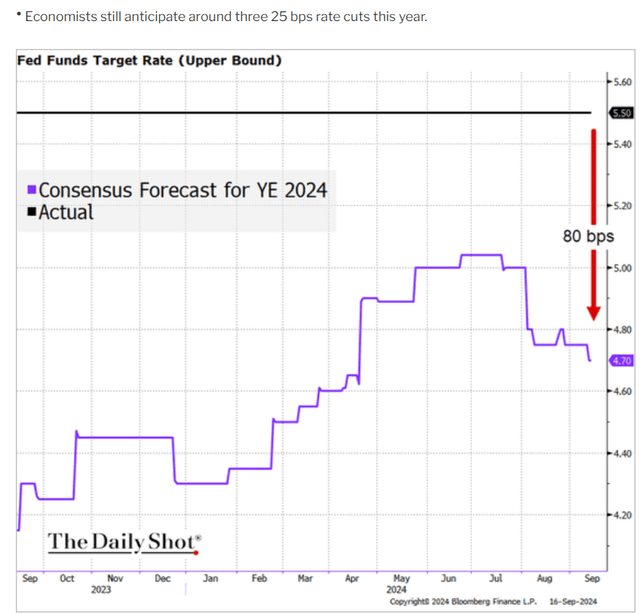
Daily Shot
I agree with the economist’s consensus that the economy’s overall strength justifies 0.25% cuts in every meeting for the rest of the year.
- Former Treasury Secretary Paulson thinks the Fed will cut 25 every meeting through all of 2025 to 2.5%.
- Both economic data and inflation data currently justify this.
If the Fed cuts 0.5%, that would be 100% justified by robust disinflation data.
If the Fed cuts 0.25%, that would be 100% justified by vital economic data.
While there are always risks to what might go wrong with fundamentals in the future, the cumulative summary of all economic data still points to a strong economy and a soft landing base case.
- Growing probability of “no landing.”
A no landing means the economy goes from its strongest since 1962 to a 2% average growth rate, with no significant dip below the 1.8% trend.
How often has the Fed been able to tame 5%-plus inflation with a soft landing? Never.
How often has a no landing occurred from 5%-plus inflation? Never.
But the pandemic threw out all the old economic models, creating unprecedented events.
-$38 Oil Was Thought Impossible Until It Happened On April 20, 2020
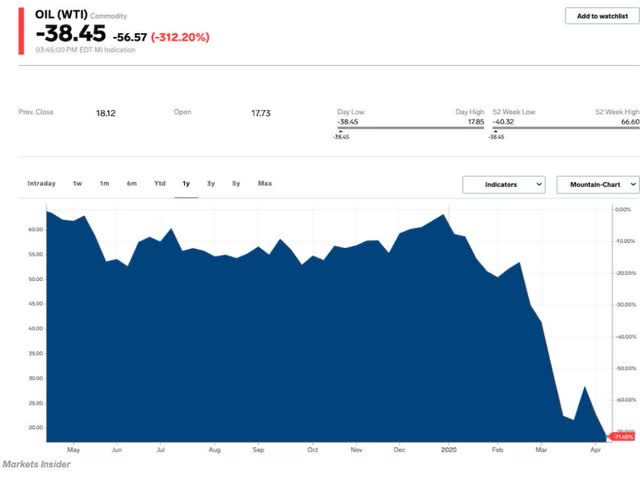
Business Insider
The pandemic has taught all savvy investors that humility is necessary for success.
If you’re 100% confident about your position, whatever it might be, you have blinders on in some way that could be dangerous to your financial health.
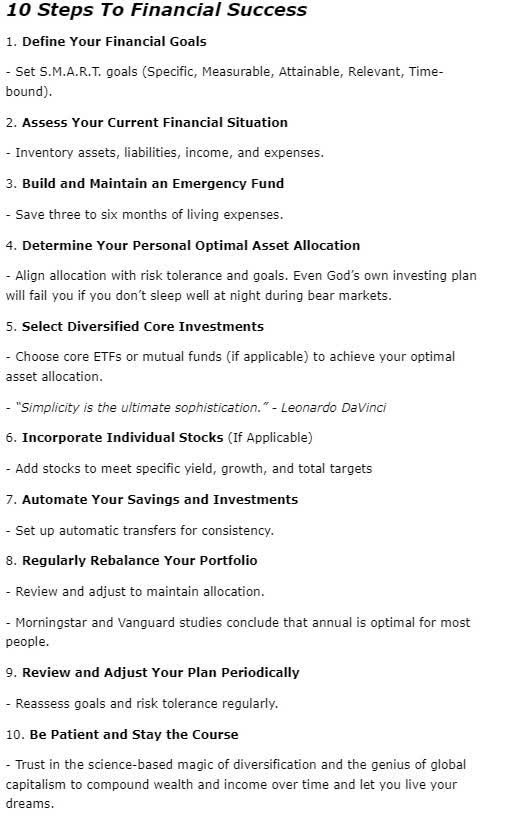
But that’s what long-term investment planning is all about. It’s about creating a bunker retirement portfolio that embraces uncertainty, including extreme volatility.
Perplexity
Jim Cramer might get the headlines with bombastic pronouncements and predictions.
But savvy investors know that carnival barkers should be ignored, doomsday prophets should be shunned, and even legitimate pundits like Joshua Brown, Charlie Bilello, Barry Ritholtz, or myself should never lead you to drastically change a well-thought-out long-term investment plan.
If your portfolio strategy depends on whether the Fed cuts 0.25% or 0.5% this week, you’re not a long-term investor but a short-term speculator.
And if you are bearish on the future of corporate profits, Bank of America has an important warning for you.
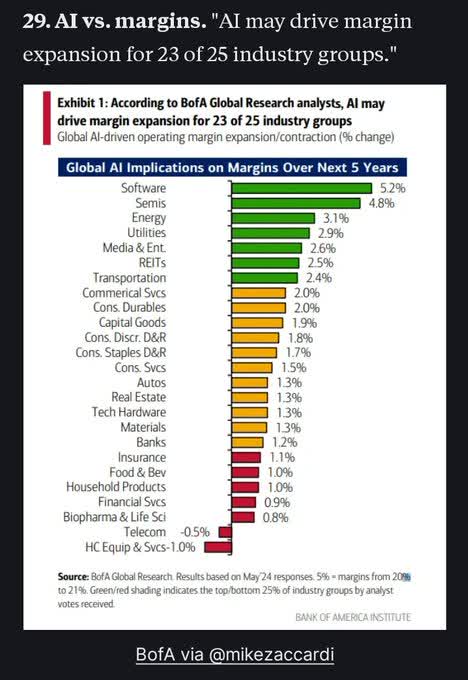
DailyChartBook
Don’t bet against the future of innovation because US companies are better than any others at figuring out ways to maximize profit margins.
The man who is bearish on the future of the United States will always go broke.” J.P. Morgan
Read the full article here


