Investment Thesis
I last reviewed the Federated Hermes U.S. Strategic Dividend ETF (NYSEARCA:FDV) on December 9, 2022, when I questioned whether this new, actively managed fund could compete with more established funds like the Schwab U.S. Dividend Equity ETF (SCHD) and Vanguard High Dividend Yield ETF (VYM). Nineteen months later, FDV’s assets under management have grown to $104 million, but unfortunately, its returns are virtually flat. Including dividends, FDV gained only 2.49% compared to 7.27% and 14.78% for SCHD and VYM. Lower-yielding alternatives like the iShares Core Dividend Growth ETF (DGRO) and the Vanguard Dividend Appreciation ETF (VIG) did even better at 18.49% and 22.70%, respectively.
Seeking Alpha
These results are disappointing and do not speak well of FDV’s viability. However, one or two years doesn’t make or break a fund, so it’s appropriate to take a second look at FDV’s fundamentals to see if I come to the same conclusion. Below is a comprehensive fundamental analysis comparing FDV with the four ETFs listed above. I’ll also examine FDV’s place in the broader large-cap value category to identify the strengths and weaknesses of its current selections. I hope you enjoy the review.
FDV Overview
Strategy Discussion
According to its website, FDV “seeks income and long-term capital appreciation by investing primarily in high dividend-paying U.S. stocks with dividend growth potential”. The fund is managed by a team of four managers, each with 20+ years of experience at Federated Hermes.
Federated Hermes
FDV’s latest fact sheet also mentions how it “offers the potential for lower volatility in weak environments”, a feature I observed in December 2022 and can confirm is the case today. FDV’s weighted average five-year beta based on current holdings is 0.81, or #23/662 lowest among the size and style ETFs I track. This puts it in good company with other dividend ETFs like the iShares Core High Dividend ETF (HDV) and the First Trust Morningstar Dividend Leaders ETF (FDL). Along with SCHD and VYM, here is how FDV compares on some of the basics:
Seeking Alpha
FDV’s 0.50% expense ratio is the highest, which is unfortunate because it works against the interests of income investors, since fees directly reduce distributions. Total returns aside, I believe this fee must be reduced if FDV is to be a successful product, as its 3.46% trailing dividend yield does not stand out. Please note that this 0.50% expense ratio includes a 0.12% waiver, which may expire as early as January 1, 2025.
Seeking Alpha
According to its prospectus, the advisor considers high-dividend-paying U.S. stocks to be ones with yields above the S&P 500 Index (1.34%). In addition, the advisor may also select stocks with market caps as low as $2 billion, with additional notes as follows:
- emphasis on less-risky, high-dividend stocks.
- focus on solid dividend yield and growth potential.
- research is fundamentally driven and bottom-up.
- balance sheet strength, earnings growth, and cash flow are considered.
Before we check how well the advisor accomplishes these goals, let’s look a bit more into FDV’s brief performance track record.
FDV Performance Analysis
We saw earlier how FDV hasn’t been a strong performer since its launch. From December 2022 to June 2024, its 0.81% total return ranks #561/575 among all the size and style ETFs I track. Specific to large-cap value ETFs, it ranks #85/89, and not coincidentally, three of the four worse-performing funds also emphasize low-volatility stocks:
- The VictoryShares US EQ Income Enhanced Vol Wtd ETF (CDC)
- The Franklin U.S. Low Volatility High Dividend ETF (LVHD)
- The ProShares Russell US Dividend Growers ETF (TMDV)
Portfolio Visualizer
While it’s normal for low-volatility stocks to underperform in strong bull markets, the degree to which they lag the broader market is shocking. Ironically, there is tremendous risk in over-emphasizing this factor, as investors miss out on huge gains that would have been possible with a more balanced approach. I think it’s the wrong factor to emphasize, as I’ve noticed diversification, quality, and sentiment take a backseat in the selection process. For evidence, let’s look closer at its selections.
FDV Analysis
Current Composition
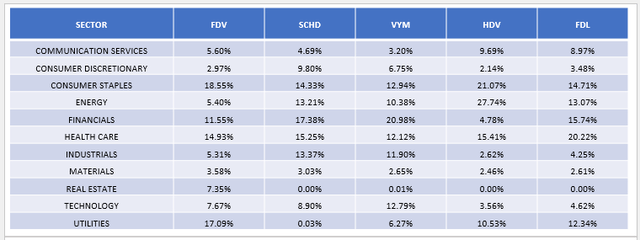
The following table lists FDV’s sector exposures alongside SCHD, VYM, HDV, and FDL. One unique feature is FDV’s 7.35% allocation to Real Estate, which indicates that not all of its monthly dividend payments are qualified for income tax purposes.
The Sunday Investor
FDV also overweights Consumer Staples (XLP) and Utilities (XLU) at 18.55% and 17.09%. Along with Real Estate (XLRE), these were the worst-performing large-cap sectors over the last year, but unfortunately, this composition is not new. FDV’s six- and twelve-month portfolio turnover rates are only 17% and 35%, so its managers appear to have high conviction and won’t easily pivot.
Fundamentals By Company
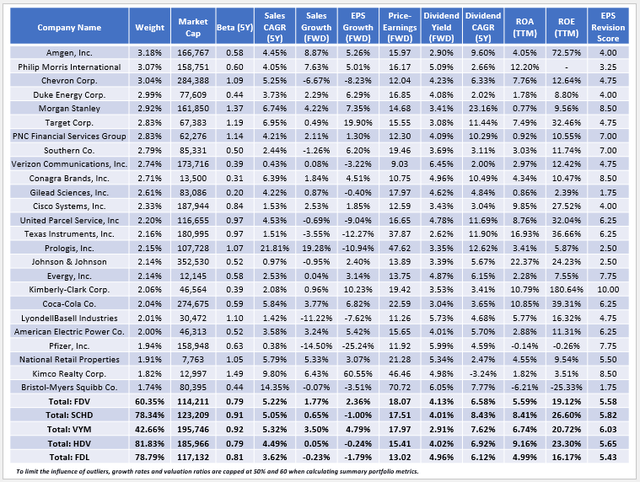
The following table highlights selected fundamental metrics for FDV’s top 25 holdings, totaling 60.35% of the portfolio. At the bottom, I’ve also included summary metrics for SCHD, VYM, HDV, and FDL.
The Sunday Investor
Here are four observations to consider:
1. FDV appears reasonably well-diversified, but I wouldn’t consider it a core holding like VYM. Its top sub-industry is Electric Utilities at 14.19%, followed by Biotechnology and Regional Banks at 9.20% and 5.53%, and it ranks #85/108 in the large-cap value category on sub-industry-level concentration. Use it as a satellite position if you find its strategy appealing, but I wouldn’t allocate much to it.
2. FDV’s Index yield is 4.13%, a statistic highlighted in these promotional materials from Federated Hermes. However, shareholders receive distributions net of fees, so the expected dividend yield is only 3.63%, which is slightly better than the fund’s 3.46% trailing dividend yield. It’s reasonably high for an Equity ETF, but still, SCHD and HDV have much lower expense ratios that allow investors to earn close to 4%. FDL has a high 0.45% annual fee, but its 4.96% Index yield is the strongest of the five, and I found at least 16 ETFs with higher trailing dividend yields, including:
- SPDR S&P 500 High Dividend ETF (SPYD): 4.58%
- First Trust Morningstar Dividend Leaders ETF (FDL): 4.50%
- WBI Power Factor High Dividend ETF (WBIY): 4.25%
- ALPS Sector Dividend Dogs ETF (SDOG): 4.21%
- Sound Equity Dividend Income ETF (DIVY): 4.21%
- Franklin U.S. Low Volatility High Dividend Index ETF (LVHD): 4.20%
- Invesco S&P 500 High Dividend Low Volatility ETF (SPHD): 4.19%
- VictoryShares US EQ Income Enhanced Vol. Weighted ETF (CDC): 4.15%
- WisdomTree U.S. High Dividend Fund (DHS): 4.07%
- AAM S&P 500 High Dividend Value ETF (SPDV): 3.98%
- Dividend Performers ETF (IPDP): 3.80%
- iShares Select Dividend ETF (DVY): 3.80%
- Opal Dividend Income ETF (DIVZ): 3.70%
- Schwab U.S. Dividend Equity ETF (SCHD): 3.67%
- VictoryShares US Large Cap High Div Volatility Wtd ETF (CDL): 3.63%
- iShares Core High Dividend ETF (HDV): 3.53%
These are arguably FDV’s primary competitors, but sadly, its high expense ratio means its dividend yield won’t stand out.
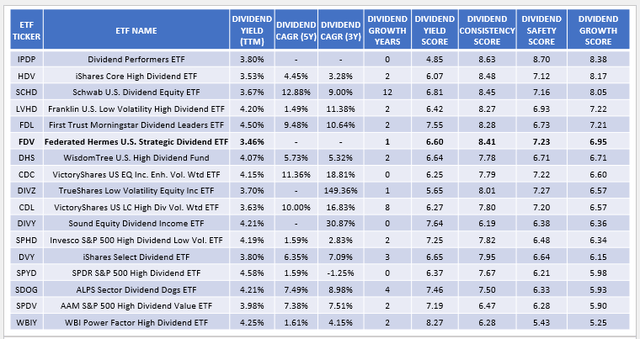
3. FDV’s prospectus indicates its managers select stocks based on their dividend growth potential, while not ignoring balance sheet strength. We can measure this objectively using Seeking Alpha Dividend Grades, which I’ve normalized on a ten-point scale and then weighted based on current holdings. Here is how FDV currently ranks on dividend consistency, growth, safety, and yield against the 16 high-yielding funds listed above. For completeness, I’ve also listed the actual dividend yield and dividend growth rates for each ETF.
The Sunday Investor
FDV’s 6.95/10 Dividend Growth Score ranks #6/17 in this sample, so it does a reasonably good job selecting dividend growth stocks. In addition, its 7.23/10 and 8.41/10 safety and consistency scores rank #3/17 and #4/17, respectively. I’m pleased with these results, and although the ETF has a limited history, I think investors can expect some decent dividend growth numbers moving forward.
4. FDV needs to improve in quality, sentiment, growth, and value to a lesser extent. Consider how its ROA, ROE, EPS Revision Score, forward EPS growth, and Forward P/E figures rank in the large-cap value category:
- ROA: 5.59% (#79/108)
- ROE: 19.12% (#61/108)
- EPS Revision Score: 5.58/10 (#87/108)
- Forward EPS Growth: 2.36% (#88/108)
- Forward P/E – Simple Weighted Average: 18.07x (#44/108)
It’s evident that FDV’s managers have chosen to emphasize stocks with low volatility and dividend growth characteristics at the expense of nearly every other factor. In my view, this approach has limited use and will only work in very specific environments, like a substantial market downturn, where defensive Utilities stocks are favored for safety.
Investment Recommendation
I’m disappointed at FDV’s weak results since its November 2022 launch, and surprised that its four experienced managers have not modified their approach over the last year and a half. I assume they are aware of their fund’s weaknesses, which include flat estimated sales and earnings growth rates, below-average quality, and poor consensus earnings outlooks for most of its holdings. However, they have decided to stake FDV’s fate on the less-volatile dividend growth stocks. It’s a bold choice but not one I recommend, so I have decided to issue FDV a “sell” rating. I hope you found this information helpful, and as always, I look forward to answering your questions in the comments section below. Thank you for reading.
Read the full article here


