Investment Summary
The so-called “energy transition” means differentiated utilities businesses could potentially benefit from growing investment in global energy infrastructure. The global power grid, in its current form, has many structural problems. This includes, but is not limited to, 1) redundant and maturing infrastructure; and 2) grid congestion, especially with heightened demand for renewables.
The congestion problem is exacerbated by the ever-increasing cointegration of renewables into the grid. This could place additional strains on the current tangible infrastructure in our best estimation.
Figure 1.
Source: Citi Investment Analytics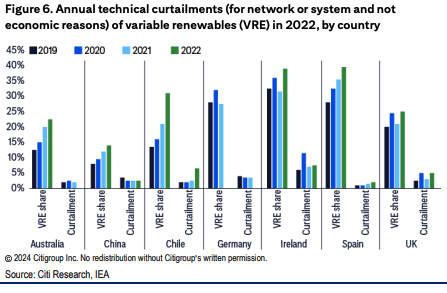
Critical metal shortages are also a potential headwind preventing the proper recovery of underlying assets in the renewables space, including capital and return on capital.
Analysis from Citi on the subject estimates that the “copper required annually for renewable capacity additions and associated grid investment can rise 2.4 million tonnes (Mt), at a 6% CAGR from 2023 to 2030, to 7.1 Mt — or to 22% of a 32 Mt copper market”.
This is c.45% “of all the global copper demand emerged on our radar growth of ~5.3 Mt we expect by the end of the decade”, Citi notes.
As such, the ability to 1) deliver low-cost energy over long-distance areas, 2) increase regional interconnectivity, and 3) increase grid reliability are crucial. They are crucial to lower incremental capital requirements for the renewable industry, reducing running costs, and ultimately producing attractive dollar returns on capital for investors.
This is the primary reason we are exploring potential allocation to companies in the renewable electricity industry on an all-equity basis.
Clearway Energy Inc. (NYSE:CWEN) (NYSE:CWEN.A) emerged on our radar as a high-yielding small cap in the space after we noted consensus estimates of a 58% growth in earnings from the company this year on fairly reasonable sales growth of 8%.
CWEN is a renewable energy infrastructure investment company. The bulk of its underlying capital is renewable energy assets throughout North America. The company structure is multilayered. CWEN is sponsored by two other entities, GIP and TotalEnergies, respectively. This occurs through a portfolio company known as Clearway Energy Group LLC, which is equally owned by GIP and TotalEnergies. Both sponsors are also in the energy infrastructure/financing business.
Figure 2. CWEN organizational structure, per Q1 FY 2024 10-Q
The Company is sponsored by GIP and TotalEnergies through the portfolio company, Clearway Energy Group LLC, or CEG, which is equally owned by GIP and TotalEnergies. (Source: CWEN Q1 2024 10-Q)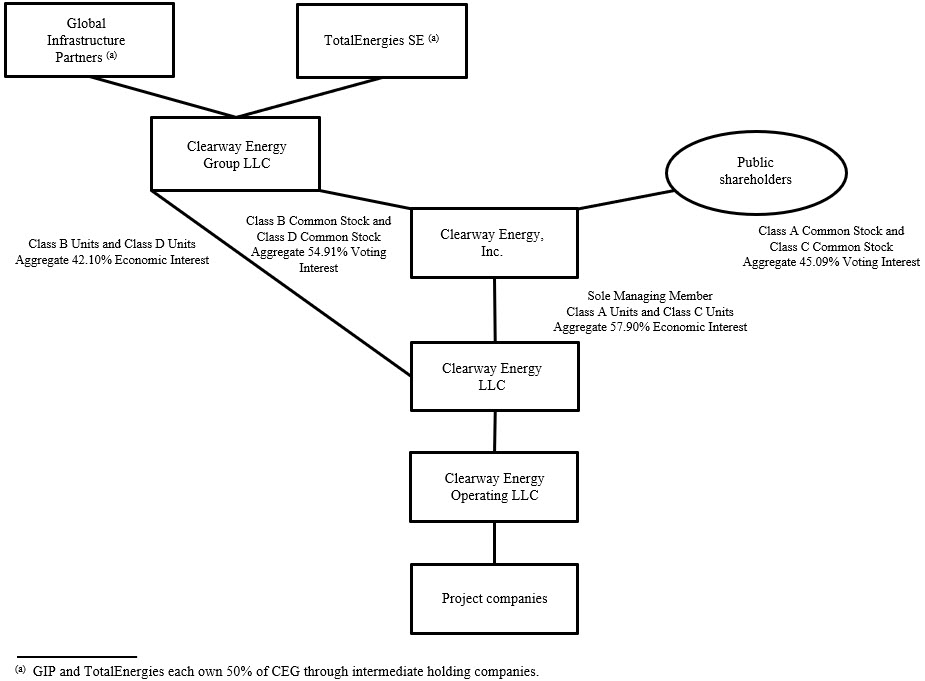
The underlying company was founded in 2012 and has 61 employees in its current form. Trailing 12-month revenues of $1.3 billion means the company produces a staggering $21.3 million in revenue per employee. This is potentially a competitive advantage against other firms with employee growth. It can produce high-dollar sales relative to the human capital employed in the business.
CWEN books revenues across two segments: conventional energy, and capacity revenue. These are reported as 1) conventional generation, and 2) renewables, respectively.
In 2014, the company did $828 million in sales on earnings of $16 million. It had grown to $1.05 billion in revenue by 2018, with earnings of $48 million. In 2023 revenues were $1.3 billion on earnings of $80 million. As seen, this is a slow-growth company, where earnings per share have grown from $0.29 10 years ago in 2014 to $0.66 in the last 12 months of business, 8.5% CAGR.
The renewable electricity industry operates on exceptionally high gross margins, mostly because the cost of revenues is amalgamated with total operating costs, excluding depreciation. The industry runs on a 65% average margin, with 18.5% pre-tax margins. Given this is a highly regulated, capital intensive industry, I’m not surprised to see it running on negative free cash flow margins. CWEN potentially has an advantage here as well, operating on 11% free cash flow margins. This is important because 1) incremental requirements in the industry are exceptionally high, 2) those funds have to come from somewhere, and 3) debt costs are currently objectively high.
Figure 3.
Company Filings
Net-net, I rate CWEN a hold due to (i) slack returns on capital, (ii) capital intensive operations, and (iii) unattractive valuations. Here, I will run through the investment thesis.
Q1 F4 2024 insights
In the first quarter of ‘24 reported on May 9th, CWEN put up $263 million in top-line sales, down from $288 million the year prior. The decrease stemmed primarily from a c.$35 million reported loss from mark-to-market accounting on its cash hedges.
Conventional renewable energy revenue increased by $23 million year over year to $221 million at the top. After deducting lease revenue and other items, the company finished the quarter with $125 million in contract revenue booked from customers, a 111% growth year over year.
Management confirmed full-year guidance, projecting $395 million in cash available from distribution on its underlying assets this year. It is eyeing 7% earnings per share growth on this, and the long-term goal is to produce cash available for distribution of $2.15 per share.
The CEO’s comments on the earnings call are additional colour here:
Furthermore, we are in excellent position towards firming up our ability to grow CAFD per share within our long-term target of 5% to 8% in 2027. The new RA contracts we signed at strong pricing and the joint development agreement signed for development of the Honeycomb battery assets, are the beginning of additional data points that we’ll share on our post 2026 growth outlook as we go through the year.
The following image represents CWEN’s renewable portfolio as of Q1 2024:
CWEN Q1 Investor Presentation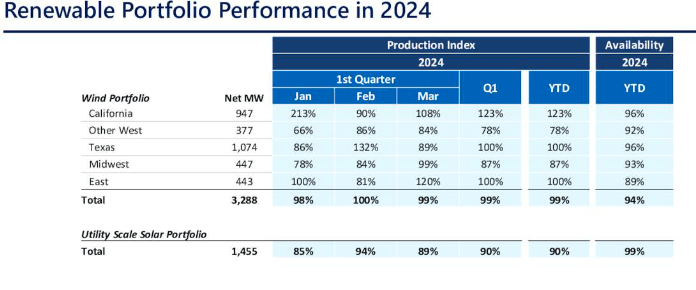
It left the quarter with $337 million in cash on hand, with an additional $472 million in liquidity available from its revolving credit facility. In total, including all sources of cash like restricted cash and reserves, the company had a little over $1.4 billion in total available liquidity at the end of the first quarter.
It also completed the following capital allocations toward what it dubbed as “growth investments“:
-
Cedar Creek Wind – the company paid $117 million in cash consideration for this company, which owns the Cedar Creek wind project, a 160 MW asset in Idaho. It sells power under a 25-year power purchase agreement (“PPA”) backed by an investment grade utility, per CWEN. Management expects the 5-year average cash available for distribution from the new underlying asset to increase by $13 million from next year.
-
Dan’s Mountain Wind – management acquired a 50% equity interest in this project which is a 50 5MW asset in Maryland. It paid $44 million in cash, implying an $88 million valuation. The power will be sold under a 12 year PPA and management expects a $4 million increase in 5-year average cash available for distribution on the asset by 2026.
-
Rosamond South I – it paid a $21 million cash consideration to purchase 50% of the equity in Rosamund South, which is a solar storage project of 250 7MW in California. Expected 5-year average cash available from distribution is around $2 million from 2026.
My views on the company’s first-quarter earnings were in line with expectations, with modest growth in sales and earnings already priced into its market value. Management’s reaffirmation of full-year guidance is constructive, particularly in the context of a potential economic slowdown over the next 12 to 24 months.
Factors impacting the recovery of underlying assets
When I think about profitability in the electricity industry, I think of thin margins, and heavy incremental capital requirements with relatively flat turnover on invested capital. This is also the trend in broad utilities generally, and therefore it is mostly the low-cost provider or those with production advantages and lower operating costs as a percentage of sales that realize the attractive economics.
Renewables businesses overcome this hurdle through their point of differentiation—that is, they are selling renewable energy, not “traditional” energy. This point of differentiation potentially gives players in this domain consumer advantages, allowing them to price offerings above the industry norm, therefore overcoming the issues on pre- and post-tax margins.
CWEN exhibits this to some extent, but when examining its other fundamentals, there isn’t enough flesh to put on the skeleton.
Figure 4 measures the gross capital productivity management has exhibited on a rolling 12 month basis since 2021. It measures the trailing 12 months gross profit divided by the total assets employed in the business. Here, gross profit is simply defined as the company’s revenues less running costs, exclusive of depreciation – basically, what it costs to produce the revenues. This shows the amount of gross income produced for every $1.00 of assets employed on the balance sheet.
As observed, the company has around $14.8 billion of gross asset value as I write, including all cash and equivalents on hand. Management has only rotated around $0.06–$0.07 in gross income for every $1.00 in assets in the company, just 7% gross capital productivity.
For context, a score above $0.30 on the dollar is considered high, and anything above $0.70 is considered exceptional. In that vein, CWEN would hypothetically sit in the lowest 10th percentile of gross capital productivity. This is not an attractive feature for a highly regulated, capital intensive business.
Figure 4.
Company filings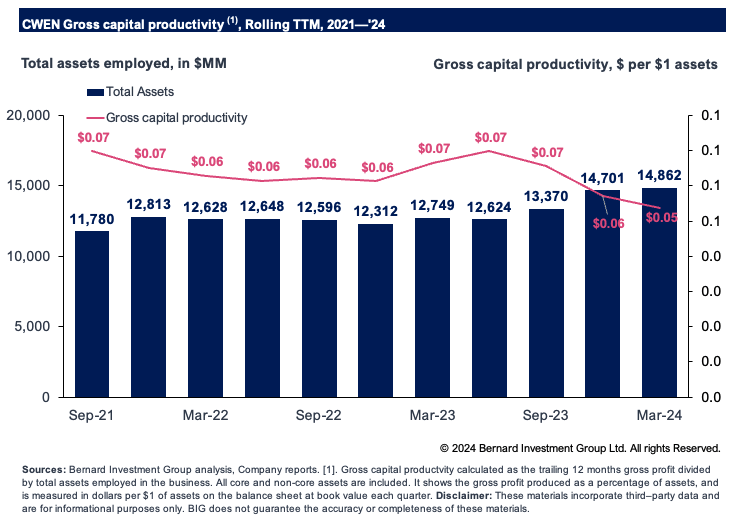
My points on this capital intensity are exemplified in Figure 5. It shows the amount of capital investment required to produce each $1.00 of new revenue on a rolling 12 month basis since 2021. Revenue growth has been statistically small at just 30 basis points on average each period. But unsurprising. The company has realised high pre-tax margins of 34.5% on this, in line with its differentiated offering in utilities.
But to produce this slack revenue growth, management has been required to invest ~$78 for every new $1 Of sales generated across this time. All of the investment has gone into working capital and fixed assets, the latter requiring a $62.85 investment to produce a dollar in revenue growth. We see this exemplified in the company’s marginally invested capital turnover of 0.1x, meaning every $1.00 investment in the company’s underlying assets returns just $0.10 in revenues. This is not attractive to me.
Figure 5.
Company filings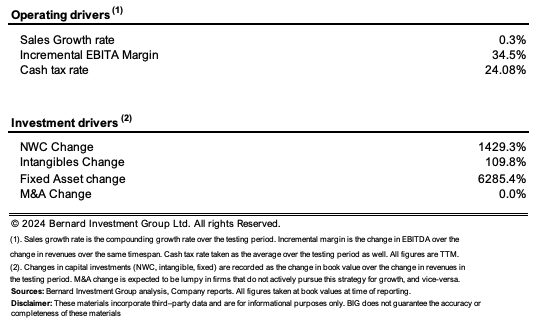
The low profit produced on this capital substantially hinders the ability to obtain a proper recovery on its underlying assets.
As seen in Figure 6, CWEN has not managed to produce greater than 4% trailing return on the capital invested in its enterprise. In 2021, it produced 4% return on $10.1 billion of capital, otherwise $402 million in post tax earnings. In the 12 months to Q1 2024, it did just 3% on $13.3 billion of invested capital.
The drivers of the company’s business returns are its exquisitely high post tax margins, as mentioned earlier. And this squares with the economics of the business.
However, CWEN has such a large capital base that it is unable to produce attractive returns on these investments, in my opinion. It does try to shed equity capital by paying dividends, having increased the dividend to $0.04 per share last period. But over the last three years, on a rolling 12-month basis, it has invested $27 per share of incremental capital into the business, only to realise a $0.10 decline in net operating profit after tax per share (-0.04% marginal loss).
Subsequently, free cash flow per share has been lumpy. It spun off $229 million in free cash last period, having reinvested up to 1,026% of NOPAT in earlier periods to get there. My numbers have the company trading at a 7.2% trailing free cash flow yield as I write, lifting to 13% including all dividends paid up. This is a reasonably attractive value in objective terms.
Figure 6.
Company filings
Figure 7.
Company filings
With this modest free cash flow yield, investors may wonder why I am being this pessimistic about the company. If it is throwing off cash at a yield of 7 to 8%, the price/value equation may very well be attractive, correct?
But this is not how we invest here at Bernard. We look for companies to produce high dollar earnings on their invested capital, with equally high free cash flow to reinvest. A “high” return is above 12% ROIC per annum in our eyes, reflecting long-term market averages. We would expect a business to produce a return on its capital above this rate to create economic value (as we believe we can comfortably achieve this 12% at a similar level of risk).
For CWEN, the rate of return it has produced on its capital is not economically valuable to us, as seen in Figure 8. Here, I show what the company needed to produce in NOPAT to hit this 12% threshold margin, versus what it actually did. The difference between the actual results and the required results is the economic profit or loss, depending on the outcome.
CWEN has experienced a series of economic losses over the testing period. For instance, in 2023, it needed to generate $1.5 billion in net operating profit after tax on $13.15 billion of capital. Instead, it produced $464 million, resulting in a $1.1 billion economic loss. So, despite recent growth, this management has not created value for shareholders. To illustrate, CWEN has produced an $88 per share economic loss since 2021 under these stipulations.
Figure 8.
Company filings
Valuation
The company sells at high multiples of earnings but low multiples of net assets and cash flow. For instance, it currently trades at 37.5x trailing earnings and 68x trailing pre-tax income. In contrast, it is priced at 1.4x book value and just 4x operating cash flow, giving a 25% cash flow yield as I write. I would add in the dividend yield of ~6% as a factor here.
In that vein, it really depends on what you are looking at CWEN for. Those income-oriented investors may find attractive value at a 25% cash flow yield.
However, the company’s economics support the low multiple of book value in my opinion. In particular, CWEN produced a trailing return on equity of 3.6%, below the sector median of 9%. Plus, I’ve already explained the tremendously thin profits earned on its invested capital.
Why would investors pay high multiples of assets for a company that is not producing attractive earnings on those assets? In other words, if paying 1.4x book value, you are likely to receive a return on equity similar to the company of ~3%.
My projections on the company’s financials over the coming few years at its steady state of operations are shown in Appendix 1. I have then projected free cash flows out over 10 years and discounted this back at 12%, as seen in Figure 9.
I’ve then compounded its intrinsic valuation as a function of its ROIC and reinvestment rates to see where it could end up over this time. Both valuations lead to a similar result, netting $23.35 when combined on an equal-weighted basis. This supports a neutral view and is well-supported in the analysis I’ve presented thus far.
Figure 9.
BIG Investments
In short
Renewable energy companies offer a potentially differentiated exposure to a commodity-like electricity industry. This enables such companies to realize higher pre-and post-tax operating margins compared to peers. But if the turnover on invested capital is not of modest strength, no amount of profit margin can increase the rate of earnings against a company’s assets.
CWEN is one example of this scenario in my opinion. Based on my analysis, the company has exquisitely high incremental capital requirements but is not balancing this with incremental earnings growth. Instead, this is a capital-hungry operation that will continually consume cash without spitting back attractive returns, in my opinion. In my view, the company is worth around $23.35 today, a shade below where it currently trades as I write. Net-net, rate hold.
Appendix 1.
BIG Investments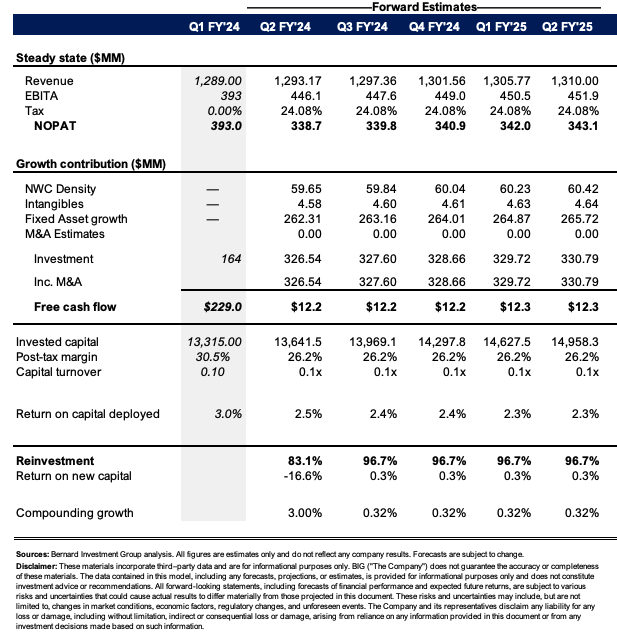
Read the full article here


