Performance Assessment
Last year, I analyzed various alternative asset management companies and picked KKR & Co. Inc. (KKR) and Blackstone Inc. (BX) as my top picks. I had a neutral view of Brookfield Asset Management Ltd. (NYSE:BAM) as I was not as confident in its alpha potential vs. the S&P500 (SPY) (SPX).
I am very performance-focused, and I hope to win your trust and readership with proof of consistent alpha generation. So as usual for any follow-up coverage I do, let’s measure my performance first:
Performance of Asset Management Companies and the S&P500 (TradingView, Author’s Analysis)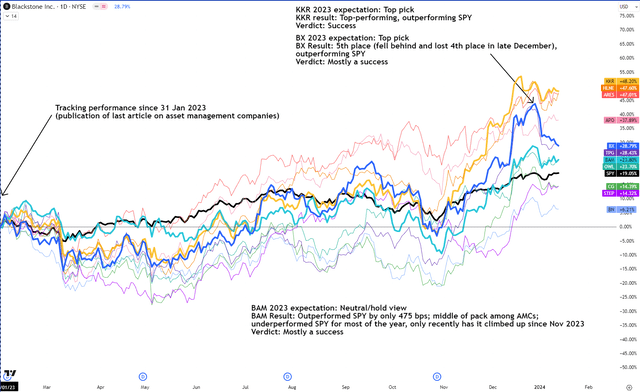
The charts above depict the total shareholder return performance
KKR (bolded yellow in the chart above) was my top pick in 2023. And it has been the outright best performance since, returning +48.20%, outperforming the S&P500’s (bolded black in the chart above) +19.05% by +29.15%.
Blackstone (bolded blue in the chart above) was also one of my top picks in 2023. It has outperformed SPY by +9.74% and has finished in the top 5 among its peers, giving up some of its performance lead in December 2023.
I was neutral on BAM (bolded cyan in the chart above) in 2023. It has underperformed the SPY for most of the year and only recently has inched up to return +23.80%, beating the SPY by a smaller margin of +4.75%.
Overall, I think my assessments have mostly played out as per expectations.
The New View on BAM
I am now changing my stance on BAM. It is my 2nd-best asset management pick right now. My top pick is Hamilton Lane Incorporated (HLNE) and KKR continues to be a favorite of mine at number 3. But I will discuss these other two later in a separate article.
Here’s why I am fundamentally bullish on BAM:
- Growth in fee-bearing capital and earnings is expected to accelerate.
- BAM is well-set to benefit from the consolidation effect.
- Carried interest on new funds will be a significant growth lever.
Growth in fee-bearing capital and earnings is expected to accelerate
Fee-Bearing Capital (FBC) Metrics (USD mn) (Company Filings, Author’s Analysis)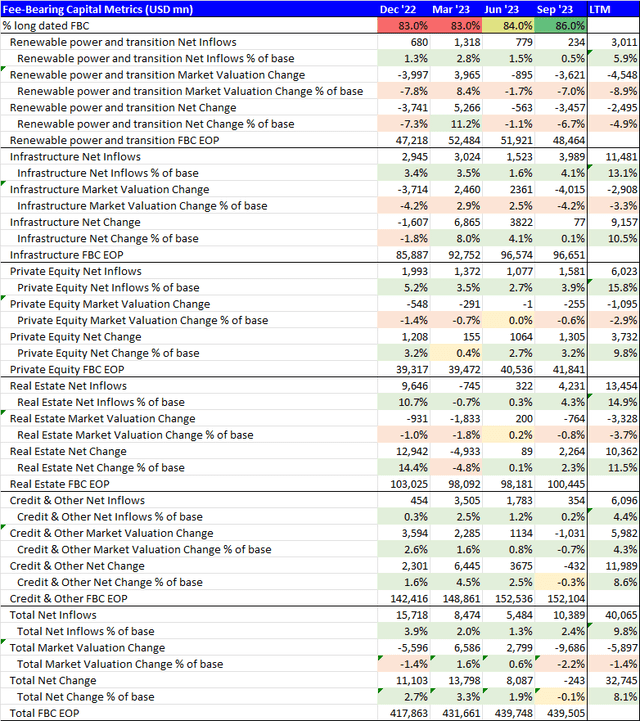
In each of its different products, BAM has had positive net inflow growth in its fee-bearing capital (FBC) base in all quarters over the last twelve months (LTM). Overall, the total net inflows have grown at 9.8% on an LTM basis. Due to a 1.4% degrowth dip in market valuations, the overall net change in FBC over the LTM is 8.1%.
Over the LTM, the movements in valuations have been negative for every product category except Credit, resulting in an overall degrowth of 1.4% due to changes in valuations alone. Growth-focused investments relating to the renewable power transition trend have seen the sharpest markdown in valuations of 8.9% over the LTM. However, with potential rate cuts on the horizon for 2024, which I’ve discussed in more depth in recent articles, I anticipate market valuation upgrades to be an additional tailwind to the FBC base.
Overall, management too expects FBCs to accelerate further at 17.2% CAGR till 2028. Fee-related earnings are also expected to grow at 16.0% CAGR till 2028. I believe management’s expectations are credible as they have a proven track record of beating previous targets. For example, in 2018, management planned to grow FBC at 14% CAGR 2023 to $245 billion:
Fee-Related Earnings Growth Plan in 2018 (BAM 2023 Investor Day)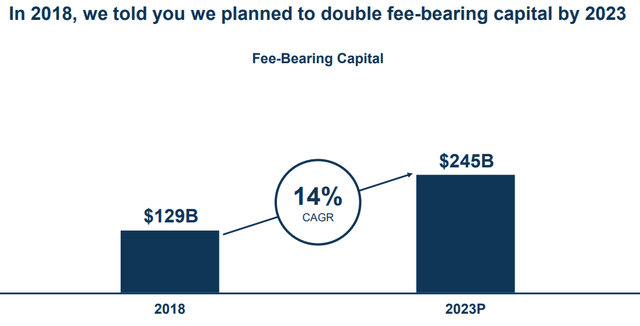
In actuality, they managed to grow at almost double the CAGR at 27%:
Fee-Related Earnings Growth Execution in 2023 (BAM 2023 Investor Day)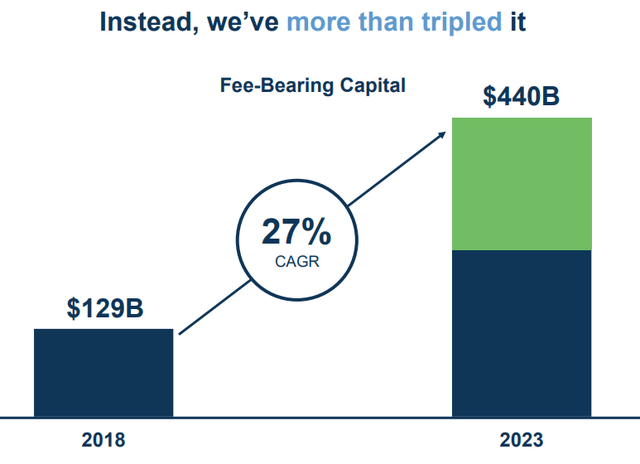
BAM is well-set to benefit from the consolidation effect
Investors are consolidating their allocations into fewer, larger alternative asset managers. As the second-largest asset management firm in AUM terms ($865 billion) after Blackstone, I believe BAM is well-set to benefit from these trends. I anticipate BAM’s specialist positioning in Infrastructure, Real Estate and Energy to further augment BAM’s attractiveness among investors looking to get exposure to these asset classes. The net inflows data in the table earlier also shows above the total average growth, particularly in two areas of strength; Infrastructure and Real Estate (13.1% and 14.9% LTM growth respectively vs. 9.8% overall average).
Carried interest on new funds will be a significant growth lever
After the spinoff from Brookfield Corporation (BN) in 2022, BN retained carried interests on existing funds. However, going forward, BAM is eligible to earn carried interest on new fund launches. Management expects to earn carry on almost 46% of FBC by 2028, implying a 43% growth CAGR:
BAM Carry-Eligible Capital Growth (BAM November 2023 Investor Presentation)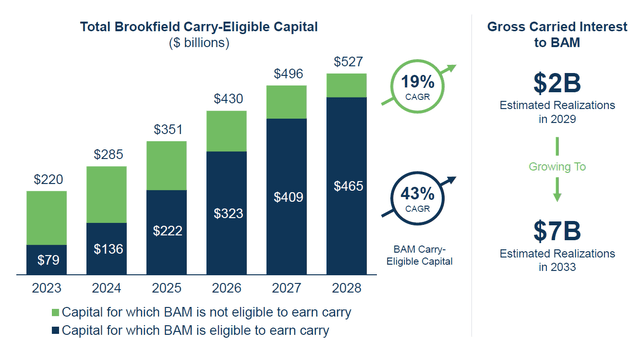
I think this is a significant growth lever, with further upside optionality depending on BAM’s performance on its investments.
Valuation is at a premium to peers but given the tailwinds, I believe it is acceptable
1-yr fwd PE Comps (Capital IQ, Author’s Analysis)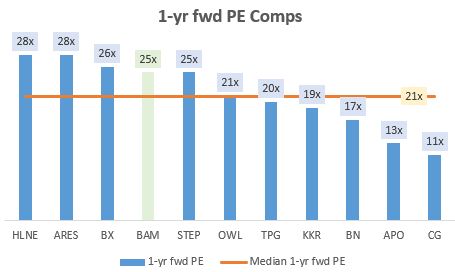
Peer group includes Hamilton Lane Incorporated (HLNE), Ares Management Corporation (ARES), Blackstone Inc. (BX), StepStone Group LP (STEP), Blue Owl Capital Inc. (OWL), TPG Inc. (TPG), KKR & Co. Inc. (KKR), Apollo Global Management, Inc. (APO), The Carlyle Group Inc. (CG).
BAM is trading at a 25x 1-yr fwd PE; above the peer group’s median of 21x, corresponding to a 19% premium valuation. This is not ideal, however, given the strong growth tailwinds, I say this is acceptable. Naturally, this does introduce a bit more valuation risk in my thesis.
Technical analysis suggests bullishness on BAM relative to the S&P500
If this is your first time reading a Hunting Alpha article using Technical Analysis, you may want to read this post, which explains how and why I read the charts the way I do, utilizing principles of Flow, Location and Trap.
BAM/SPX500 Relative Technical Analysis (TradingView, Author’s Analysis)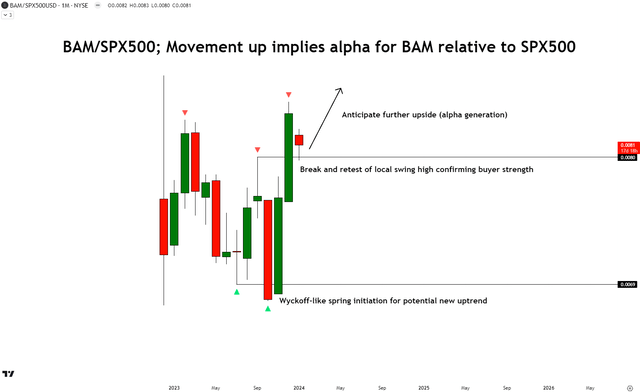
From a technical analysis perspective on the relative chart of BAM/SPX500 on the monthly chart (I focus on relative charts as I am focused on alpha generation vs. the S&P500 (SPY) (SPX)), I notice that there has been a Wyckoff-like spring initiation on the current impulse leg up. The last local swing high has been cleared through, and it looks like there is a retest occurring right now in January 2024. I interpret this as proof of buyers’ strength. I anticipate the prices on this relative chart to continue marching up. This would imply the alpha generation of BAM relative to the S&P500.
Key Risks and Monitorable
In addition to the valuation risks mentioned earlier, I notice that fee-related earnings (FRE) growth can be a bit uneven and lumpy. For example, the last 2.5-yr CAGR of FRE prints 18.3%, however the 2-yr CAGR shows 3.2%:
BAM Fee-Related Earnings (USD mn) (Company Filings, Author’s Analysis)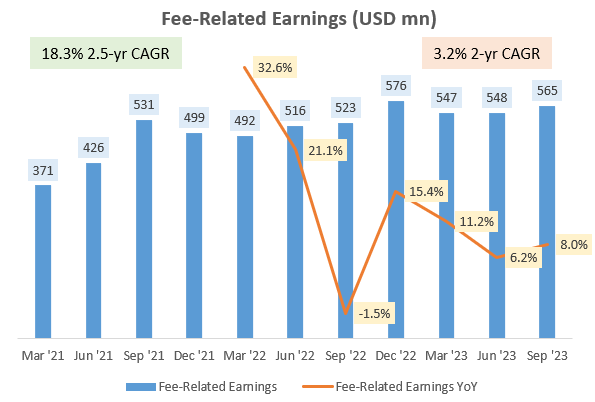
FRE growth would be linked to the growth in FBC. And hence any delays or cancellations in planned FBCs would trigger downside expectation revisions on BAM’s stock. Hence, I will be monitoring for consistent FBC growth every quarter. Any hiccups in a consistent tick-up here would warrant a deeper look into the reasons and potentially a revision of expectations.
Takeaway
In 2023, KKR & Co. Inc. (KKR) and Blackstone Inc. (BX) were my top alternative asset management picks. Brookfield Asset Management Ltd. (BAM) was a neutral/hold for me as I did not have faith in its alpha potential earlier. A performance review reveals that these assessments have been broadly correct. KKR in particular was a clear win as it ended up being the absolute best-performing alternative asset management firm among the 11 analyzed.
Now early in 2024, I am changing my stance on BAM to a bullish one as it is in my top 3 list of alternative asset management stocks. This is because I anticipate the positive growth in fee-bearing capital and fee-related earnings to accelerate, augmented by the additional benefit of being able to earn carry interest on new fund launches. I expect BAM’s large size and specialist positioning in infrastructure, real estate and energy to aid in market share gains as investors consolidate allocations into fewer, larger alternative asset managers.
Given the bright growth prospects, valuations currently do come at a 19% premium to the median of the peer group. However, I believe this risk is acceptable. Lastly, my read of the technicals relative to the S&P500 suggests a bullish outlook as well as the relative ratio of BAM/SPX500 emerges from a Wyckoff-like spring to create a bullish break and retest of the latest swing high, with readiness to target clear skies ahead.
How to interpret Hunting Alpha’s ratings:
Strong Buy: Expect the company to outperform the S&P500 on a total shareholder return basis, with higher than usual confidence.
Buy: Expect the company to outperform the S&P500 on a total shareholder return basis.
Neutral/hold: Expect the company to perform in line with the S&P500 on a total shareholder return basis.
Sell: Expect the company to underperform the S&P500 on a total shareholder return basis.
Strong Sell: Expect the company to underperform the S&P500 on a total shareholder return basis, with higher than usual confidence.
The typical time horizon for my views is multiple quarters to a year or more. It is not set in stone. I will share updates on my changes in stance in a pinned comment to this article and potentially a new article discussing the reasons for the change in view.
Editor’s Note: This article discusses one or more securities that do not trade on a major U.S. exchange. Please be aware of the risks associated with these stocks.
Read the full article here


