
The stock market, as measured by the S&P 500 Index
SPX,
suffered a sharp pullback after Fitch Ratings downgraded the debt of the U.S. government. The decision echoes Standard and Poor’s downgrade in 2011; S&P never upgraded the U.S. rating after that. Given that there were numerous overbought conditions in place prior to the downgrade, we are now starting to see some sell signals emerge.
Now that the S&P 500 has fallen back, last week’s highs in the 4600 area represent resistance. So far, the pullback has only reached the rising 20-day moving average, which is normal for a bull-market pullback. The first support level at 4528 was broken, but there are important support levels below that: 4440 (which would close all the gaps in the red circle on the accompanying SPX chart), 4330, and 4200.
The latter two should represent strong support, for a good deal of work went into creating those levels as support. However, if the 4330 level is penetrated, then the entire SPX chart takes on a much more negative tone.
On July 27th, a “classic” “modified Bollinger Band” sell signal was issued, but we don’t trade those — preferring to wait for further confirmation that creates a McMillan Volatility Band (MVB) sell signal. That confirmation would come if SPX trades at 4502 or lower. The target for a MVB sell signal is the lower, -4σ Band, which is currently at 4400.
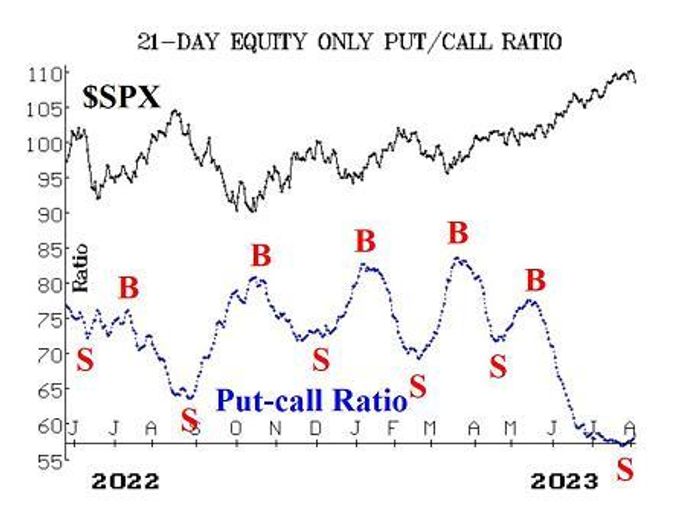
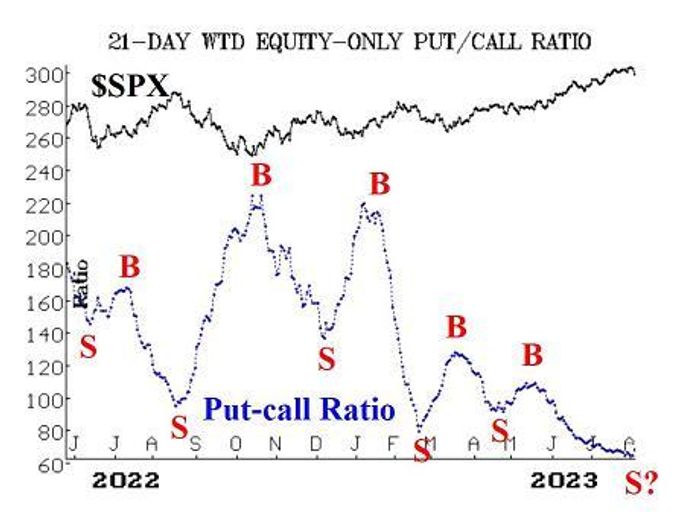
Equity-only put-call ratios have been overbought for some time now and have continued to decline. It is only when they roll over and begin to rise that a sell signal is confirmed. That has happened with the standard ratio, as it has clearly risen for the last several days. The weighted ratio was more reluctant to capitulate, and only on Wednesday did it finally move higher. The computer programs that we use to analyze these charts have been grading them as “sell signals” for over a week now. So, it appears that this important sentiment indicator is generating sell signals, too. If one acts on these sell signals, a convenient stop-out would be if the ratios fell to new lows.
Market breadth has been quite strong but could not withstand the extremely negative breadth of the August 2nd selling. That has canceled out the oscillator buy signals, but we require a two-day confirmation of any new signal from breadth. So, Thursday’s action will be important: if breadth is negative again, then both of these breadth oscillators will be on sell signals.
In a related matter, we saw cumulative volume breadth (CVB) move to a new all-time on Monday, July 31st. That normally is an indication that SPX will follow along to a new all-time high of its own. We took long positions based on that CVB indicator, but the market has gone down quickly since then. There is quite a bit of room between the current SPX price and its all-time high at 4808, so this could be a strong buy signal.
A couple of caveats: 1) not every system works every time, and 2) the last time we got one of these buy signals after a long hiatus was June 2020 (SPX eventually advanced 198 points to a new all-time high), but right after the signal was confirmed, SPX fell almost 200 points before reversing and eventually gaining the new high. The market was more volatile back then — still rather close to the pandemic-induced volatility — so, be aware that this is not necessarily a one-way signal for SPX to immediately race to a new all-time high.
New 52-week Highs on the NYSE have continued to outnumber New 52-week Lows, so this indicator remains bullish. This buy signal would be stopped out if New Lows exceed New Highs on the NYSE for two consecutive days.
VIX
VIX
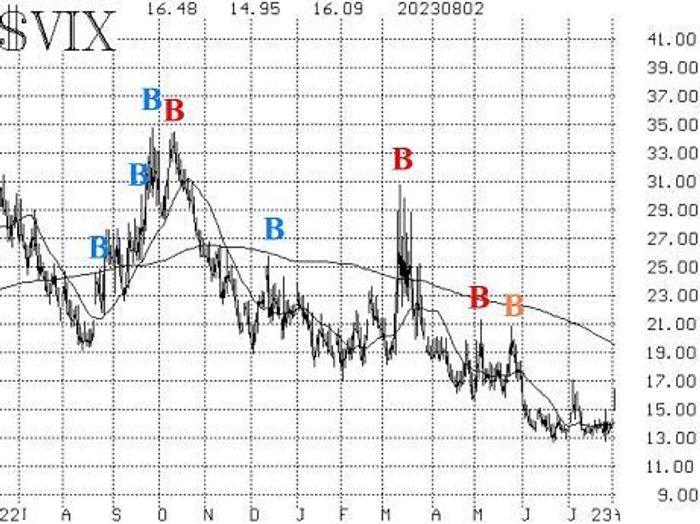
jumped higher on the heavy selling that accompanied the debt downgrade. It is very close to entering “spiking” mode. When VIX is in “spiking” mode, that is negative for stocks, and the market can decline sharply. Eventually, though, a “spiking” VIX leads to a “spike peak” buy signal. VIX enters “spiking” mode if it rises at least 3.0 points (using closing prices) over any 1-, 2-, or 3-day period. On Thursday, VIX would enter “spiking” mode if it closes above 16.63.
The construct of volatility derivatives is something to watch closely when the market begins to decline. If the term structure of the VIX futures begins to flatten and invert, that is extremely negative. So far, that has not happened. The term structure continues to slope upwards. The same is true of the term structure of the CBOE Volatility Indices.
In summary, we are still maintaining a “core” bullish position. We have rolled in-the-money calls up to higher strikes all along the way with this recent rally, so our exposure has been lessened to that extent. We will trade other confirmed signals around that “core” position.
New recommendation: Potential MVB sell signal
As noted above, a MVB sell signal will be confirmed if SPX trades 4502 or lower at any time. If it does trade there, then:
Buy 1 SPY
SPY
Oct (18th) at-the-money put and Sell 1 SPY Oct (18th) put with a striking price 40 points lower.
The target for an MVB buy signal is the lower (-4σ) Band, while the sell signal would be stopped out if SPX rose and closed above the +4σ Band.
New recommendation: Equity-only put-call ratio sell signal
The standard ratio is clearly on a sell signal, and the weighted ratio appears to have generated one as well. Therefore, we are going to take a bearish position in line with these sell signals.
Buy 1 SPY Sept (15th) at-the-money put and Sell 1 SPY Sept (15th) put with a striking price 30 points lower
We will stop out of this trade if either equity-only put-call ratio moves to a new 2023 low.
Follow-up action:
All stops are mental closing stops unless otherwise noted.
We are using a “standard” rolling procedure for our SPY spreads: in any vertical bull or bear spread, if the underlying hits the short strike, then roll the entire spread. That would be roll up in the case of a call bull spread, or roll down in the case of a bear put spread. Stay in the same expiration and keep the distance between the strikes the same unless otherwise instructed.
Long 800 KOPN
KOPN,
: The stop remains at 1.70.
Long 2 expiring SPY Aug (4th) 459 calls: This is our “core” bullish position. The calls have been rolled up four times, including once this past week (when SPY traded at 459 on July 27th). Now roll to the Aug (18th) 459 calls. Stop out of this trade if SPX closes below 4330. Roll up every time your long SPY option is at least 6 points in-the-money.
Long 1 expiring SPY Aug (4th) 459 call: Bought in line with the “New Highs vs. New Lows” buy signal. The calls have been rolled up four times, including once this past week (when SPY traded at 459 on July 27th). Now roll to the Aug (18th) 459 calls. Stop out of this trade if, on the NYSE, New Lows outnumber New Highs for two consecutive days. Roll up every time your long SPY option is at least 6 points in-the-money.
Long 2 PFG
PFG,
Aug (18th) 80 calls: This position has been rolled up twice. We will hold this position as long as the weighted put-call ratio remains on a buy signal.
Long 10 VTRS
VTRS,
August (18th) 10 calls: The stop remains at 10.15.
Long 5 CCL
CCL,
Aug (18th) 17 calls: The stop remains at 17.10.
Long 2 PRU
PRU,
Aug (18th) 87.5 calls: roll to the Aug (19th) 95 calls. We will continue to hold these calls as long as the weighted put-call ratio remains on a buy signal.
Long 8 CRON
CRON,
Aug (18th) 2 calls: We will hold these calls without a stop while the takeover rumors play out.
Long 6 ORIC
ORIC,
Aug (18th) 7.5 calls: The stop remains at 7.40.
Long 2 EW
EW,
Aug (18th) 95 puts: We will continue to hold these puts as long as the weighted put-call ratio remains on a sell signal.
Long 4 SPY Sept (29th) 480 calls: This is the position taken in line with the CVB buy signal. We are aholding SPY calls with a striking price equal to SPY’s all-time high. We will hold without a stop initially.
Long 5 EEM
EEM
Oct (20th) 41 calls: We will hold these calls as long as the EEM weighted put-call ratio remains on a buy signal.
All stops are mental closing stops unless otherwise noted.
Send questions to: [email protected].
Lawrence G. McMillan is president of McMillan Analysis, a registered investment and commodity trading advisor. McMillan may hold positions in securities recommended in this report, both personally and in client accounts. He is an experienced trader and money manager and is the author of the best-selling book, Options as a Strategic Investment. www.optionstrategist.com
©McMillan Analysis Corporation is registered with the SEC as an investment advisor and with the CFTC as a commodity trading advisor. The information in this newsletter has been carefully compiled from sources believed to be reliable, but accuracy and completeness are not guaranteed. The officers or directors of McMillan Analysis Corporation, or accounts managed by such persons may have positions in the securities recommended in the advisory.
Read the full article here
