
Second Half Playbook
On Friday, I joined Seana Smith on Yahoo! Finance where I discussed the playbook for the next 6 months:
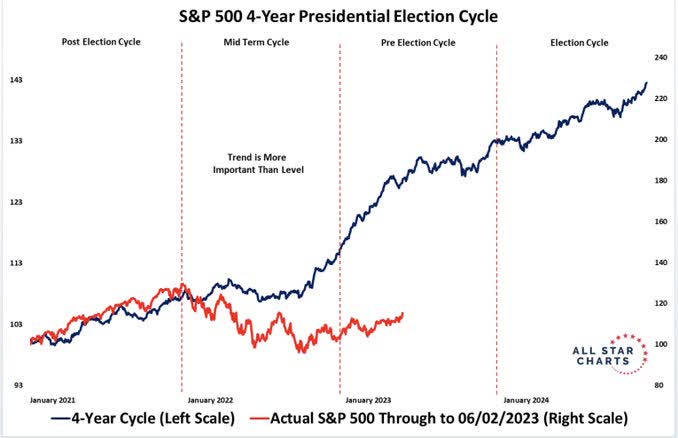
This chart ties in one of the key points I made above:
Carl Quintanilla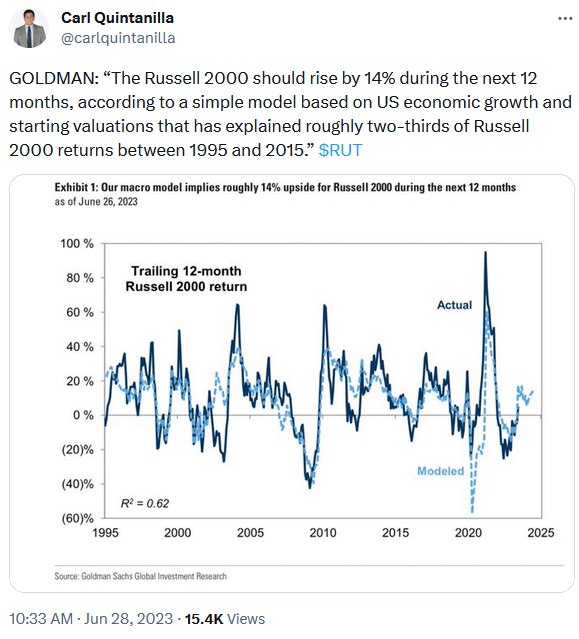
The purpose of the following charts and tables is to remind skeptics that the data continues to come in better than expected. While the back half of the year returns for the indices may be more muted than the first half, there is still significant opportunity. However, the most money will be made “under the surface” with dozens of individual laggards that can be up 20, 30, 50 and even 100%+ in 2H.
Positioning
Commercials still long, Hedge Funds still short the whole way up! We continue to follow the commercials and ignore the large managers who told you to sell at the October lows.
Finviz BofA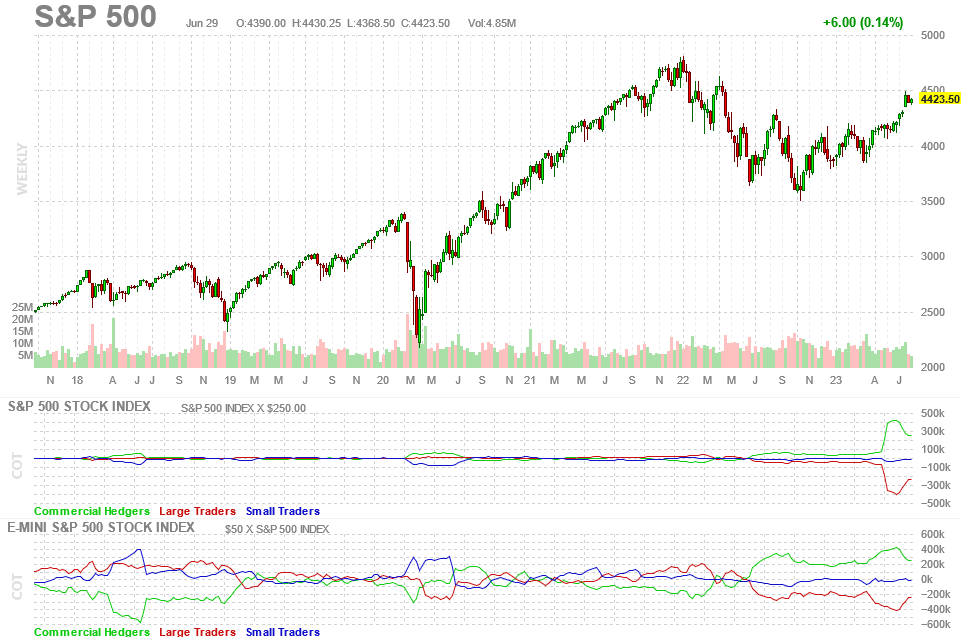
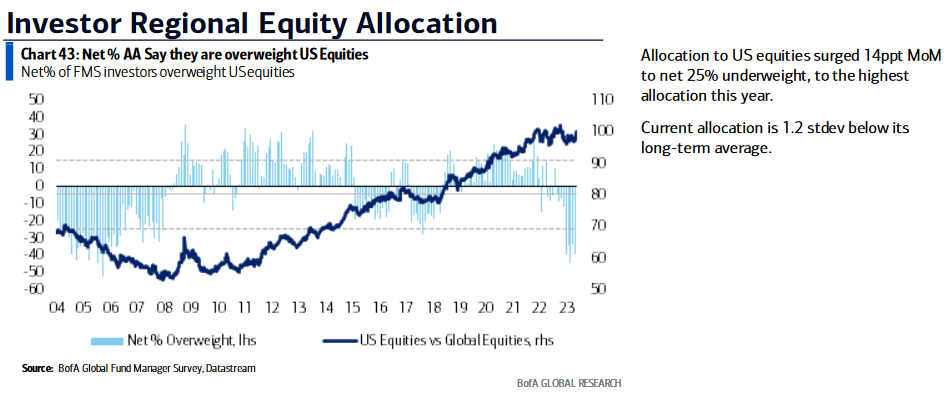
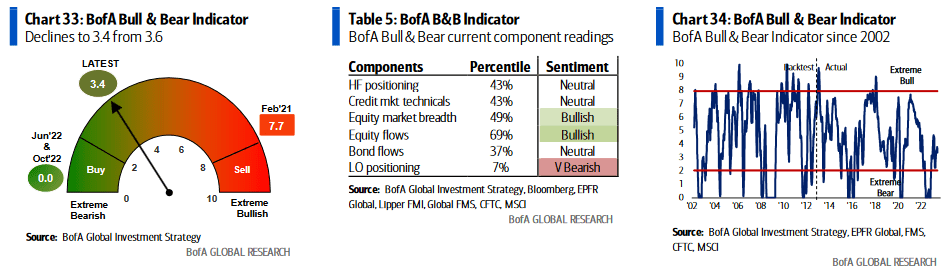
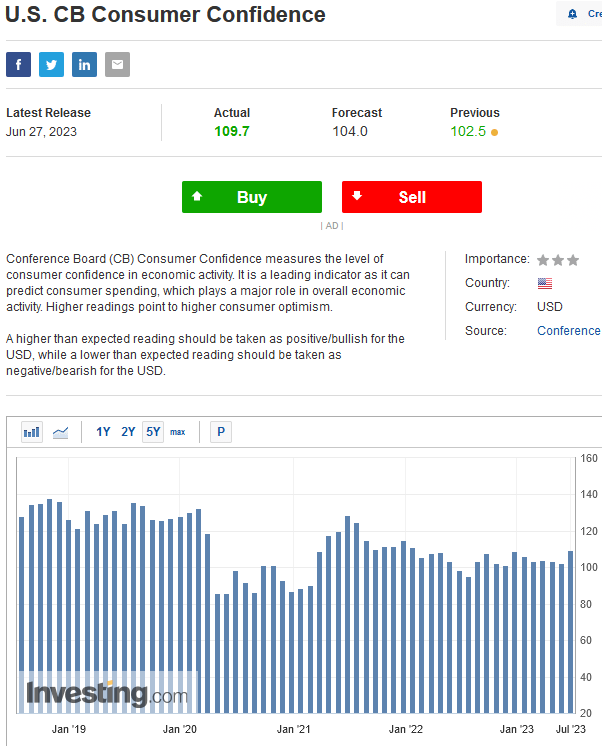
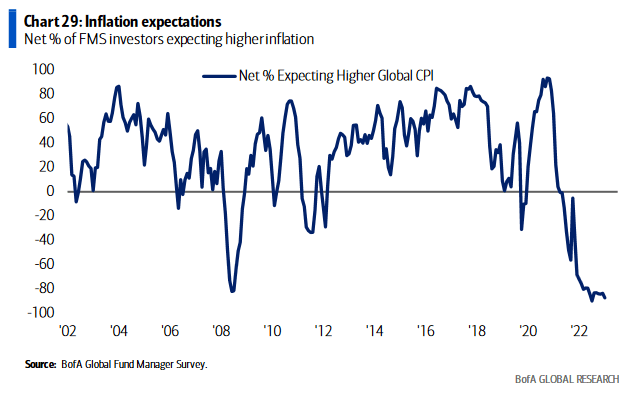
Sentiment
BofA BofA Investing.com Yardeni.com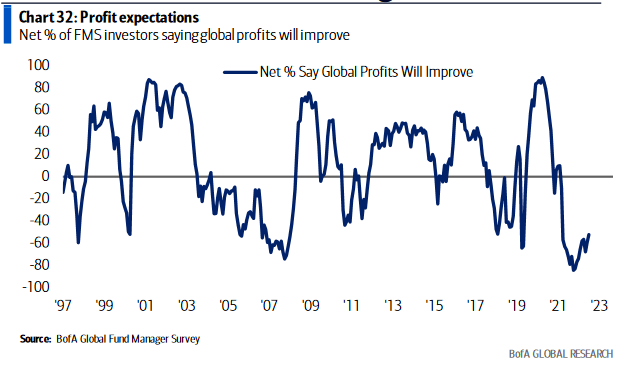
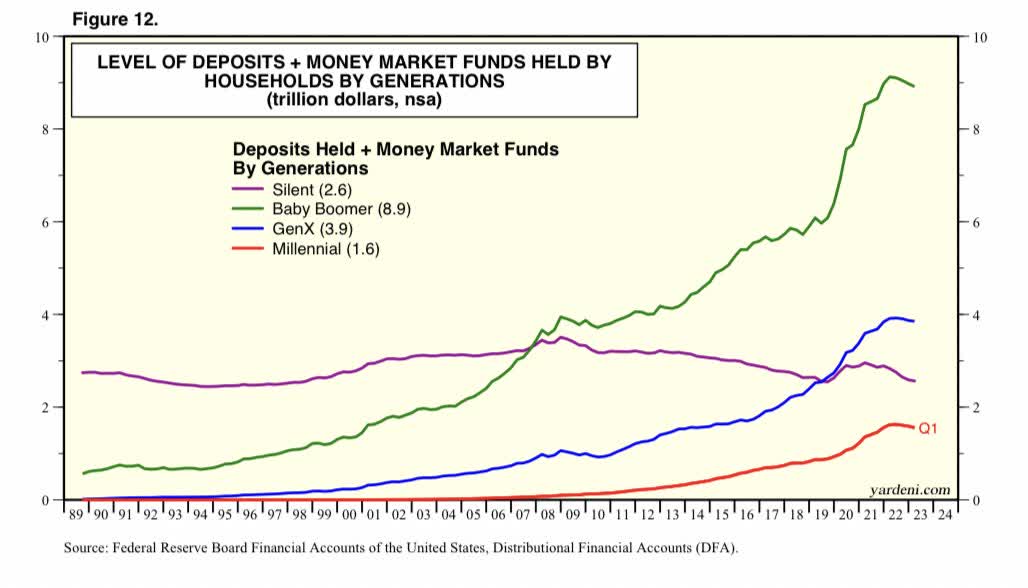
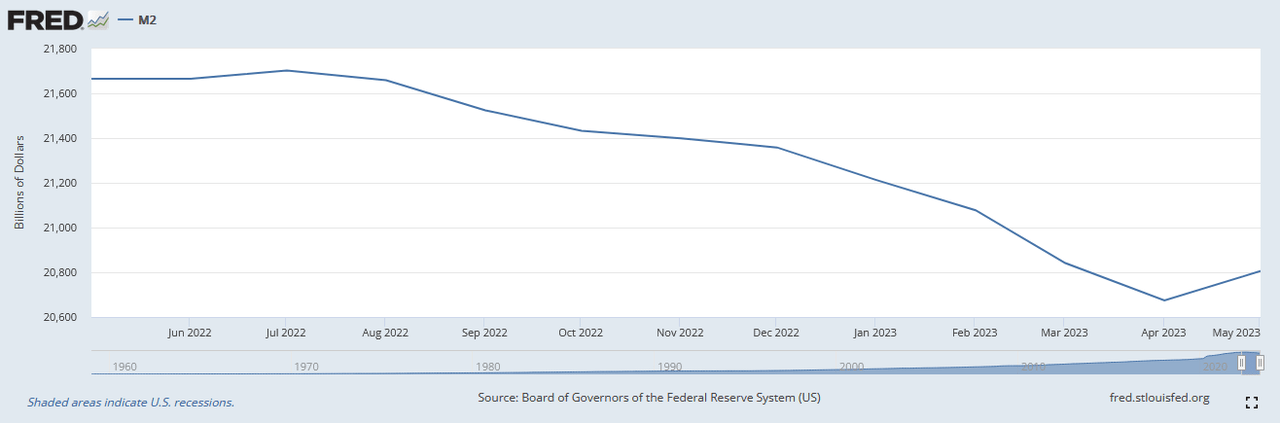
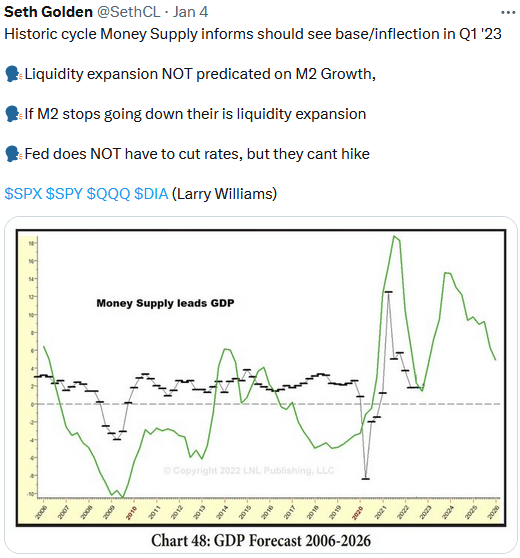
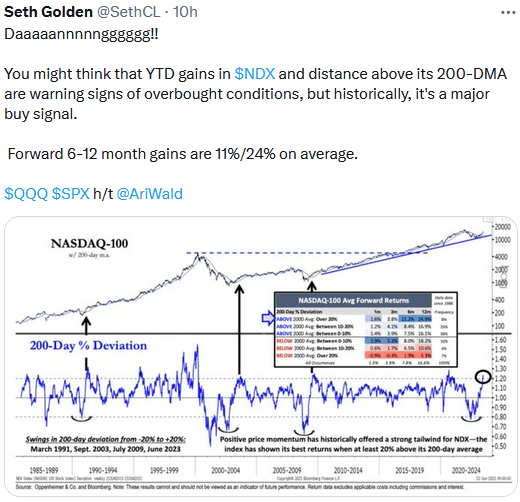
Money Supply
Seth Golden fred.stlouisfed.org Seth Golden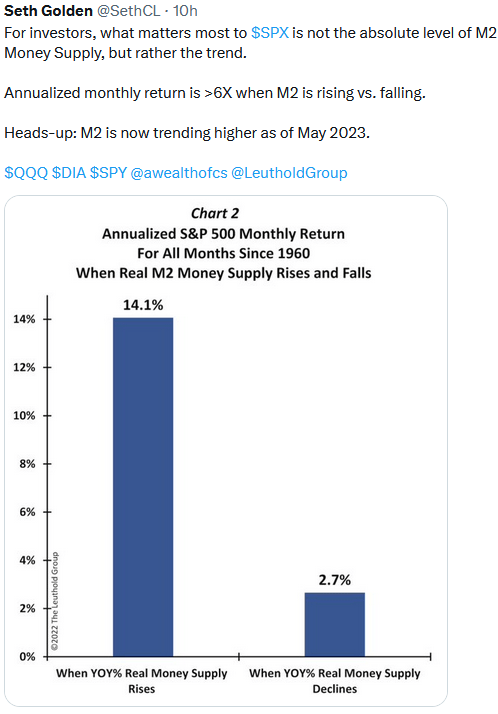
Earnings Expectations
Earnings: Set up going into Q2 earnings season the same as going into Q1.
-For Q2, the estimated earnings decline for the S&P 500 is -6.5%
-Q1 had a similar set-up and wound up at -2%.
-Everyone has been calling for a 20% earnings decline since October. Instead, we got a 25% rally in the S&P 500.
-What now? 2024 estimates are going UP in recent weeks to ~$247.
FactSet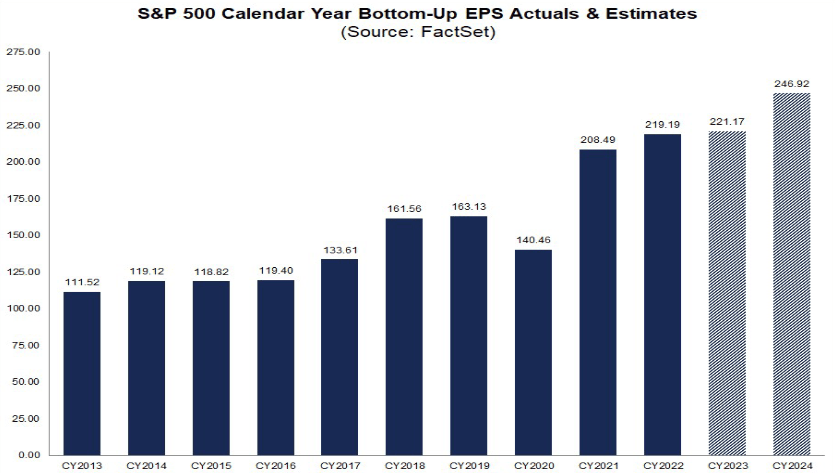
Analysts playing “catch up” on buy ratings:
FactSet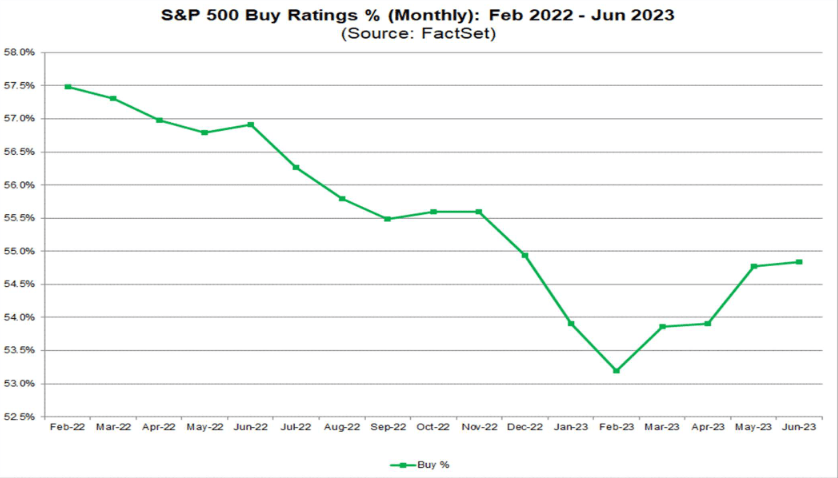
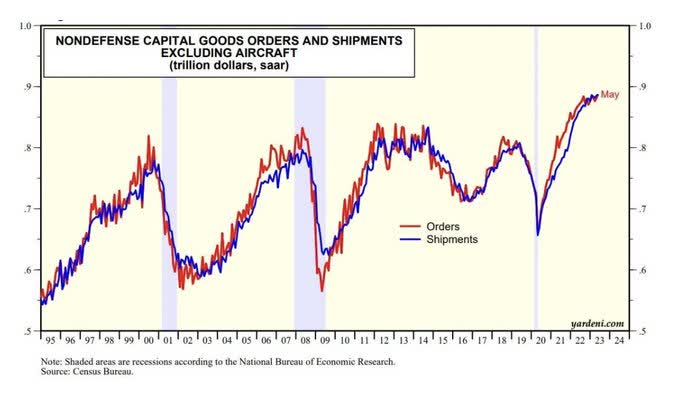
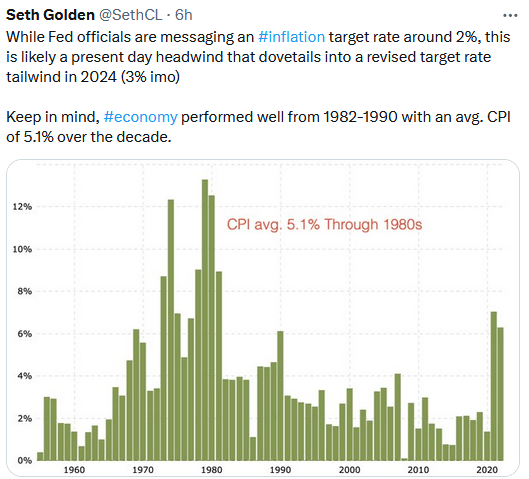
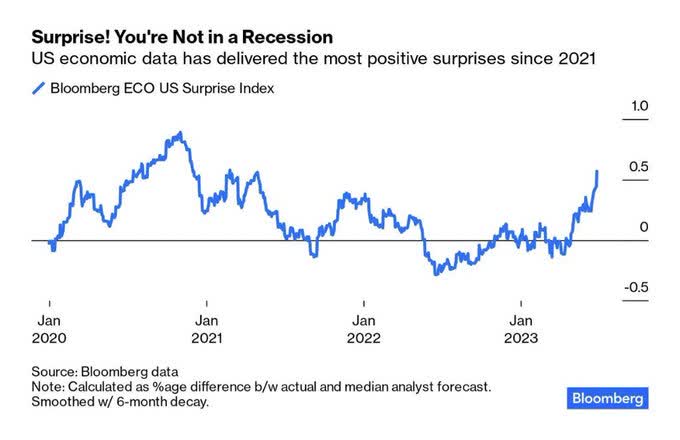
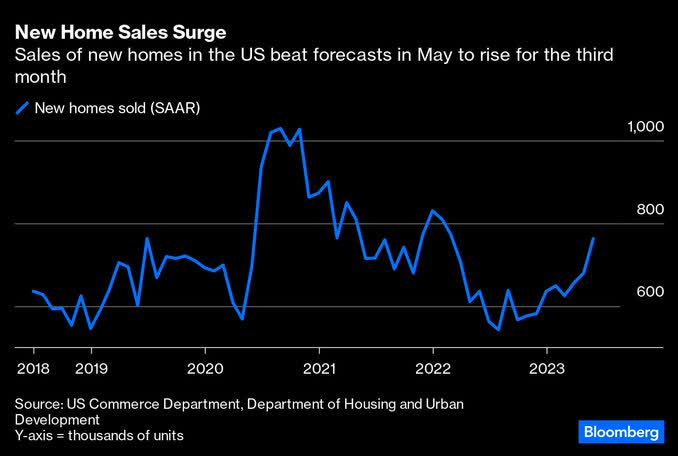
Economic Data
S&P Global PMI Yardeni.com Seth Golden Bloomberg BofA Bloomberg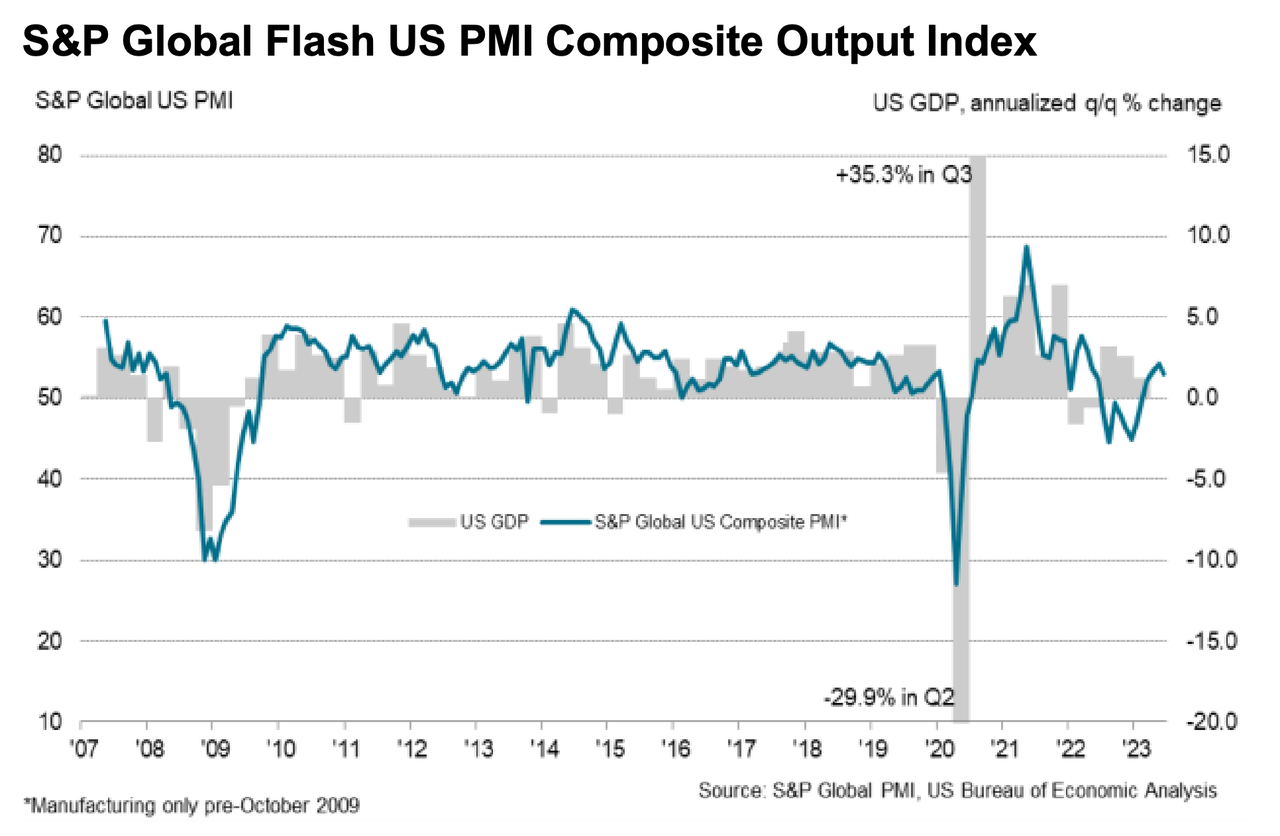
Seasonality
Ryan Detrick Seth Golden All Star Charts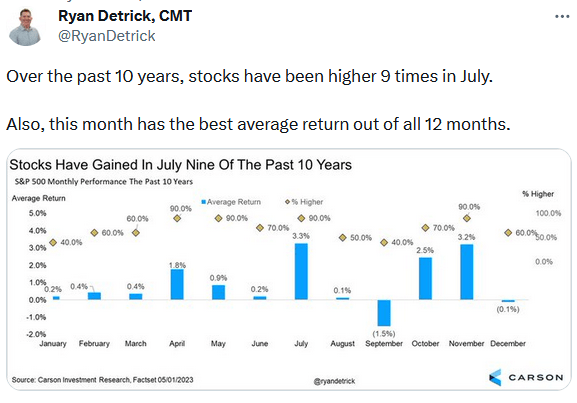
UK
BofA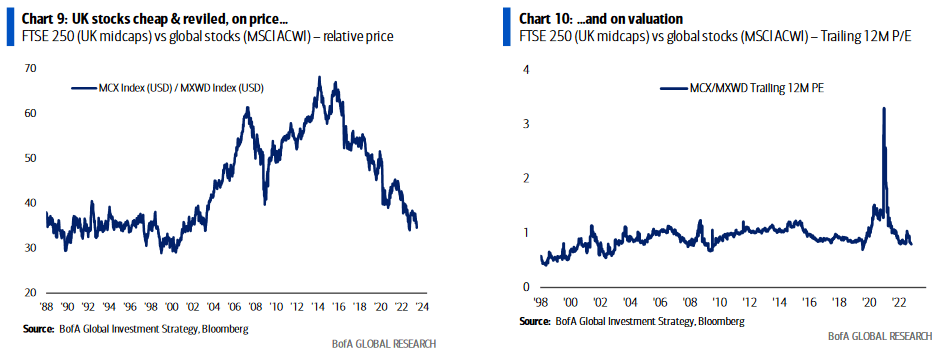
Banks
BofA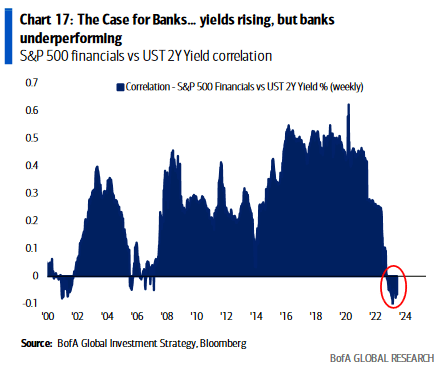
Now onto the shorter term view for the General Market:
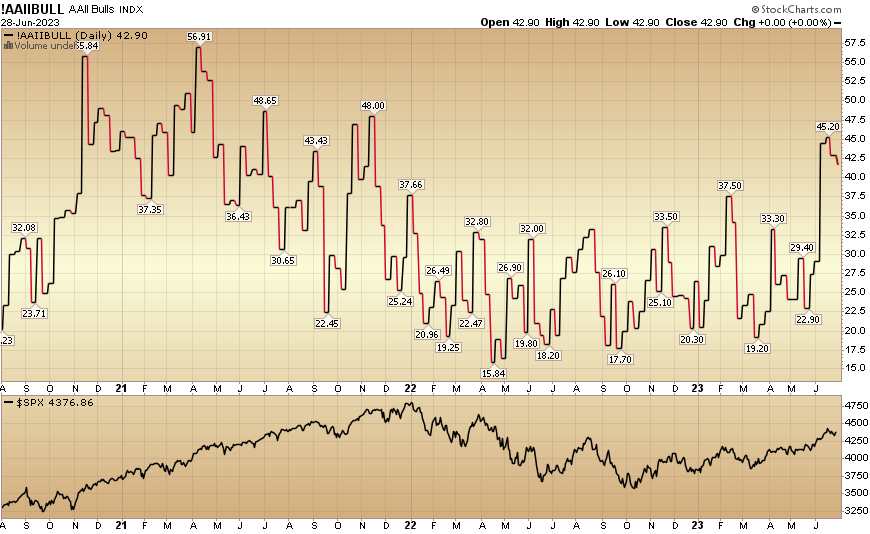
In this week’s AAII Sentiment Survey result, Bullish Percent ticked down to 41.9% from 42.9% the previous week. Bearish Percent flat-lined at 27.5% from 27.8%. The retail investor is still optimistic. This can stay elevated for some time based on positioning coming into these levels.
AAII.com Stockcharts.com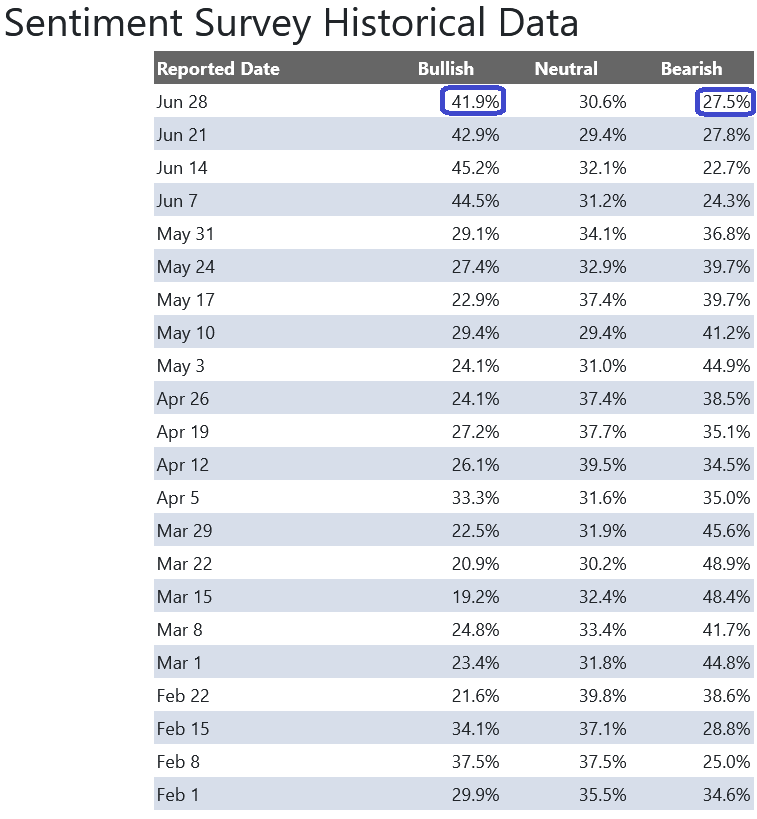
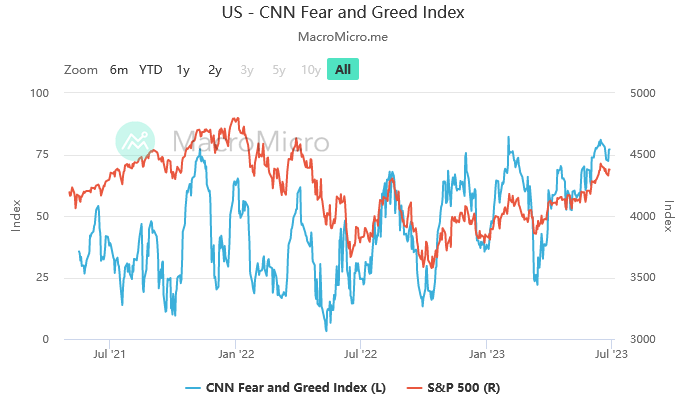
The CNN “Fear and Greed” flat-lined from 79 last week to 79 this week. Sentiment is hot but it would not surprise me if it stays pinned for a bit to force people out of their bunkers and back into the market.
CNN MacroMicro.me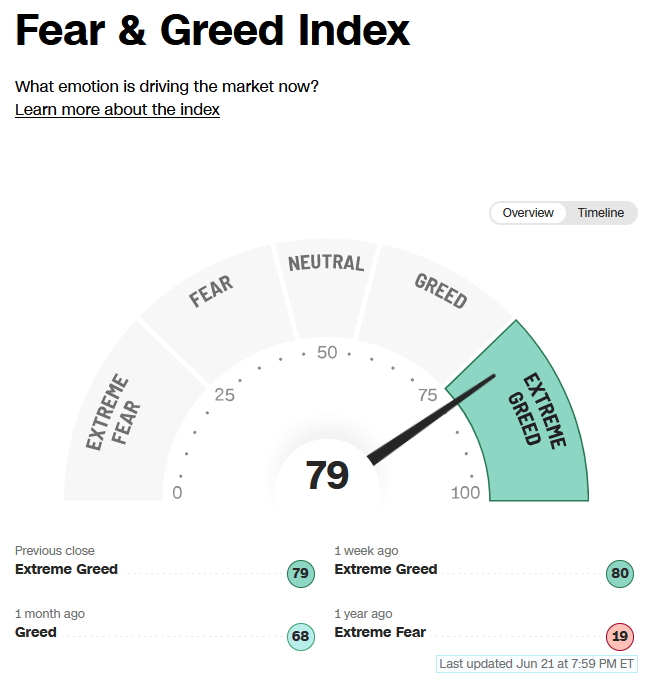
And finally, the NAAIM (National Association of Active Investment Managers Index) ticked up to 83.60% this week from 81.66% equity exposure last week. Managers have been chasing the rally.
Stockcharts.com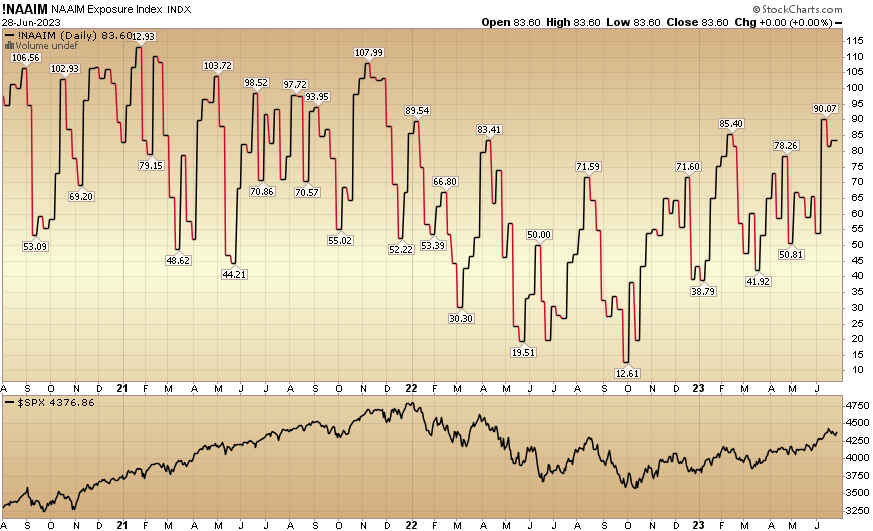
*Opinion, not advice. See “terms” at hedgefundtips.com.
Read the full article here
