
Navigating Today’s Environment It’s Just Math
Beginning in March 2022, the Federal Reserve (Fed) raised interest rates at the fastest pace since the 1980. Financial markets are now pricing in for the central bank to be near the end of its hiking cycle (Figure 1).
Figure 1: The Fed may be pausing soon
Source: Bloomberg, BlackRock as of April 24, 2023. FOMC OIS stands for Federal Open Market Committee Overnight Indexed Swap.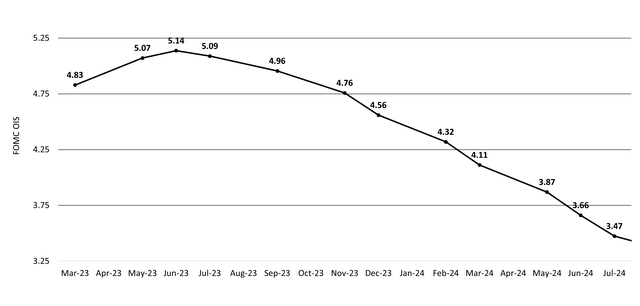
With yields at current levels, bond funds can lock in longer-term yields, offer price appreciation potential, and overall serve as a hedge against a possible hard landing. Though elevated cash balances worked during the Fed’s hiking cycle, we believe now is an opportunity for clients to consider adding duration given the potential for a Fed pause.
While investors are not penalized for being early to adding duration, there is a potential cost to being late (Figure 2). Historically, cash underperforms when the Fed stops hiking (Figure 3).
Figure 2: Act quickly – there’s an opportunity cost to being late. Core bond yields have fallen quickly when the Fed stops hiking.
Average change in 10-year yield in months around the last Fed rate hike cycle (%).
Source: Bloomberg, BlackRock as of March 30, 2023. Time period as of 1979-2019. Past performance is no guarantee of future results. Index performance is shown for illustrative purposes only. It is not possible to invest directly in an index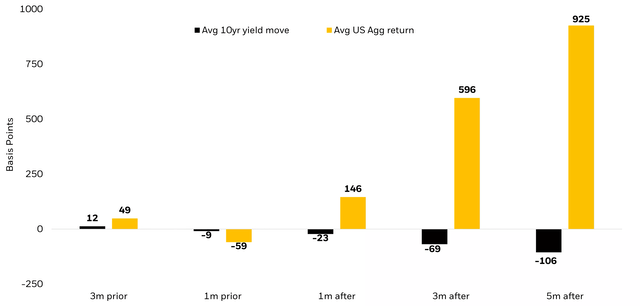
Figure 3: Potential Fed interest rate hike pause and historical bond performance
Average 12 months following the last Fed hike (2/4/94 – 4/30/23).
Source: Morningstar as of April 30, 2023. Asset class returns represented by respective Morningstar category. Past performance does not guarantee or indicate future results.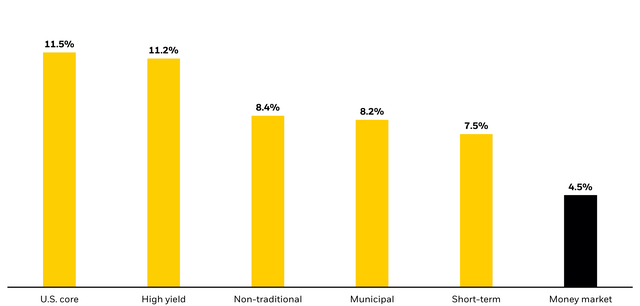
Duration as a Hedge
In today’s environment of slowing growth and inflation volatility, duration may offer a hedge against potential market volatility and be used as a portfolio ballast. Amidst the Fed getting close to pausing, this bodes well for core bond funds, like the BlackRock Total Return Fund (MAHQX) and the BlackRock Core Bond Fund (BFMCX), that may be able to offer defense in times of market stress in the form of income. For example, during periods when the Fed is hiking interest rates, the correlation of US Treasuries to equities is positive (+27%), however when the Fed is on hold or cutting rates the correlation drops (-16%)1.
In addition, as markets were rattled by the US regional banking crisis in March of this year, Total Return and Core Bond saw positive returns as equities sold off (Figure 4).
Figure 4: When stocks sold off, bonds provided ballast
Returns during US Regional Banking Crisis (March 8, 2023 – March 15, 2023)
Source: Bloomberg, BlackRock as of March 30, 2023. Institutional shares class is used for both BLK Total Return and BLK Core Bond. *Cash is defined as US Treasury Short Bond Index. Past performance is no guarantee of future results. Index performance is shown for illustrative purposes only. It is not possible to invest directly in an index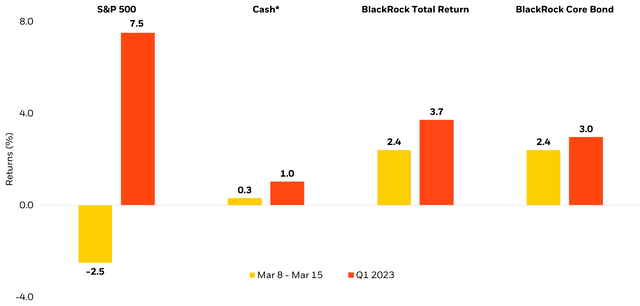
Case Study: Positioning the 60/40 Portfolio
As of September 30, 2022, the average advisor’s portfolio was underweight fixed income by 9%2. In a market regime with over half of fixed income yielding over 4%, advisors should consider bringing bonds back to the benchmark level or to an overweight as higher yields may provide downside protection for bonds, potentially lowering your probability of loss (Figure 5). In periods of slowing growth, stocks may experience higher volatility, while high-quality bonds may offer a stable source of returns.
Figure 5: Yields are back
With rising yields, active sector rotation remains key in navigating this volatile market environment.
Source: Bloomberg, as of May 31, 2023. 2021 yield is as of January 7, 2021. Past performance is no guarantee of future results. Index performance is shown for illustrative purposes only. It is not possible to invest directly in an index.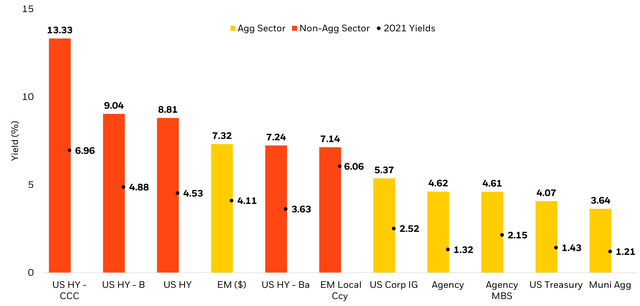
As of the latest rebalance in March 2023, BlackRock’s Target Allocation Hybrid 60/40 Model latest rebalance currently holds 59% and 39% of its portfolio in equities and fixed income, respectively – with the remainder being in cash. In this rebalance, the Model looked to enhance the overall quality of the portfolio and maintain its overweight to duration.
To increase equity diversification, dynamically navigate today’s bond market, and source active returns, the Model now holds a 17% allocation to BlackRock’s Total Return Fund, making it the Model’s largest fixed income allocation (Figure 6).
Figure 6: Positioning BlackRock’s Total Return in a Whole Portfolio Solution
Below shows BlackRock’s Target Allocation Hybrid 60/40 Model as of the latest rebalance, March 17, 2023
Note: As of March 17, 2023, the total amount of fixed income allocation in the BlackRock Target Allocation Hybrid 60/40 Model is 39%, with BlackRock Total Return making up 17%.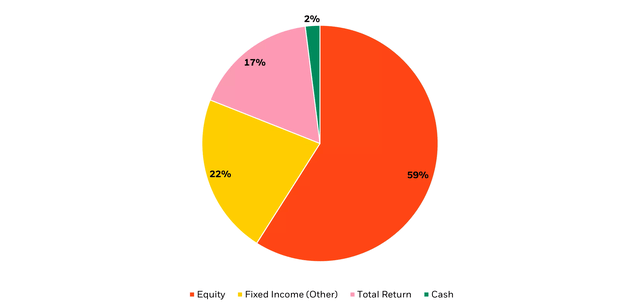
The Total Return Fund is an actively managed fixed income strategy which seeks to realize a total return exceeding that of the benchmark, Bloomberg US Aggregate Index. The Fund profile may be able to provide investors with core-bond like defense with core-plus like performance. The fund employs a diversified multi-sector approach built to navigate different market environments (Figure 7).
Figure 7: Total Return is more diversified than the Bloomberg US Aggregate Bond Index
Contribution to risk by strategy
Source: BlackRock, as of May 31, 2023.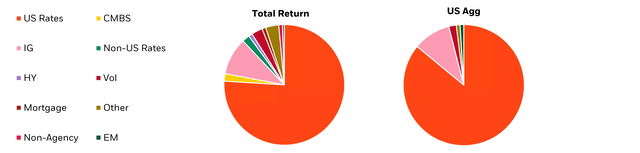
Summary
As the Federal Reserve nears the end of its hiking cycle, we believe now is an opportunity for investors to consider adding duration back to their portfolios. Duration may provide defense against potential market volatility and be used as a portfolio ballast during periods of slowing growth and inflation volatility. History shows that core bonds act as a diversifier when equity markets sold off.
The BlackRock Total Return Fund, employs a diversified approach with sufficient flexibility in order to navigate periods of market volatility, while providing a cushion in the form of income, and broad portfolio diversification. This has resulted in generating Core Plus-like returns with Core-like risk. As of May 31, 2023, the fund has a Yield to Worst (YTW) of 5.49% vs. 4.58%, Bloomberg US Aggregate.
In addition, BlackRock Core Bond provides investors with a diversified, core-bond exposure that seeks to generate attractive risk-adjusted returns that exceed the fund’s benchmark, Bloomberg US Aggregate Index. The fund has a YTW of 5.08% as of May 31, 2023.
Figure 8: Fund Performance
Source: Morningstar as of April 30, 2023. The above lists out the percentile ranking for the fund’s respective Morningstar categories. BlackRock Total Return Fund is in the Morningstar Intermediate Core Plus Bond Category, and BlackRock Core Bond Fund is in the Morningstar Intermediate Core Bond Category. Total Return Fund was ranked 1yr, 109/618; 3yr, 258/567; 5yr, 161/544; 10yr, 82/469. Core Bond Fund was ranked 1yr, 104/467; 3yr, 115/438; 5yr, 92/422; 10yr, 86/374. Rankings are based on total return excluding sales charges, independently calculated and not combined to create an overall ranking.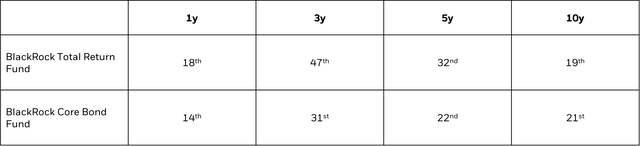
1 Source: Bloomberg as of March 31, 2023.
2 Source: BlackRock, Aladdin. Data as of September 30, 2022, based on 5,417 portfolios.
3 The BlackRock Target Allocation Hybrid 60/40 Model invests in both BlackRock Exchange Traded-Funds and Mutual Funds.
This post originally appeared on the iShares Market Insights.
Read the full article here
