Editor’s note: Seeking Alpha is proud to welcome Kai-Frederik Kossyk as a new contributor. It’s easy to become a Seeking Alpha contributor and earn money for your best investment ideas. Active contributors also get free access to SA Premium. Click here to find out more »
Investment Thesis
Encavis (OTCPK:ENCVF) is a large renewable energy provider. They manage solar/wind-parks and sell the electricity to large corporations through long-term contracts. The business model is very capital intensive, but once the parks are in place, they will be very predictable and highly profitable. Due to rising interest rates, the competition to acquire such parks is diminishing. Encavis is taking advantage of this situation to accelerate growth. The stock is down about 35% since the 2021 high and, in my opinion, offers a good risk/reward ratio at present.
Introduction
Encavis is an acronym for: ENergy (“Energy forms the basis of our collective activity and work”) CApital (“We invest capital to acquire wind farms and solar parks to generate attractive returns”) and VISion (“We are working towards a future with decentralised power generation from wind power and solar energy”). They generate electricity in two ways: Solar(PV) and Wind. They also have a small Asset Management Arm.
Geographical breakdown of assets (Encavis Website)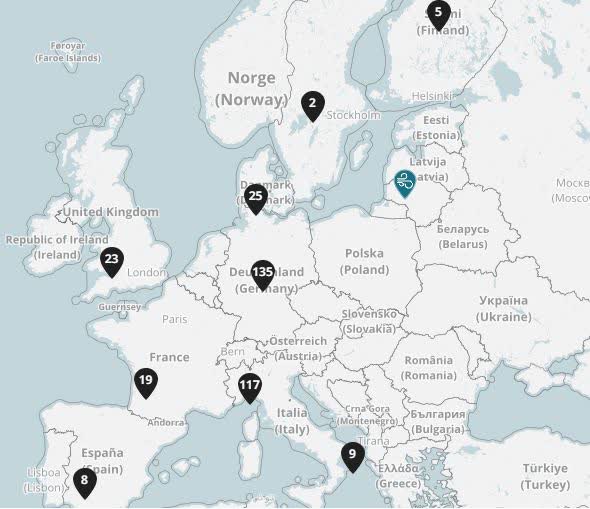
Encavis originated in Hamburg, Germany, but is gradually conquering Europe. They are currently focusing on Italy, France, England and Sweden, as there is either a lot of wind or sun to be found.
Business Model
Encavis’ business model is to acquire completed parks and manage them. They do not build the parks themselves. This is an important point as it significantly mitigates the risk, as it means that risks such as permits not being issued or conservation zones being built do not fall on the company.
Business model: risk structure (Encavis Factbook)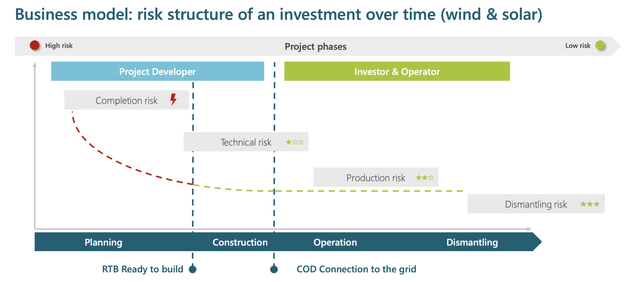
They sell the electricity to companies via so-called PPAs (power purchase agreements). These are long-term contracts for the purchase of electricity that usually run for 20 years. They also have an asset management arm where they do parks for institutional investors, insurance companies or other large corporations. This is a very interesting part of the company because it is very high margin, requires little capital, and is low risk.
Encavis Business Model (Encavis-Conf-Call-FY-2022)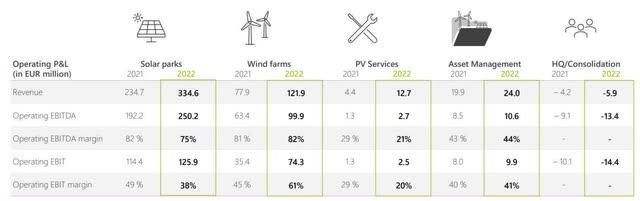
Today, Encavis offerings can be divided into the following four categories:
- PV Parks (68.7% of total revenue in FY22).
- Wind Parks (25% of total revenue in FY22).
- Asset Management (5% of total revenue in FY22).
- PV Services (1.3% of total revenue in FY22).
How are the parks bought and financed?
Encavis currently has 12 strategic partnerships with developers. These build parks and give Encavis a right of first refusal. The parks are financed individually. This means that the loan does not run directly through Encavis’ balance sheet but is financed via ABS (asset backed securities) over an average term of 20 years. This spreads the risk of default over many parks and makes the company even more secure. The PPAs are negotiated in such a way that the income covers the ongoing interest and repayments, leaving a small profit margin for the company. The parks become really interesting after about 20 years, as they are then fully paid for and generate electricity and, as a consequence, money for shareholders until the end of their technical possibilities. That is the moment when the business model becomes very interesting.
Cash flow over time of an asset (Encavis Factbook)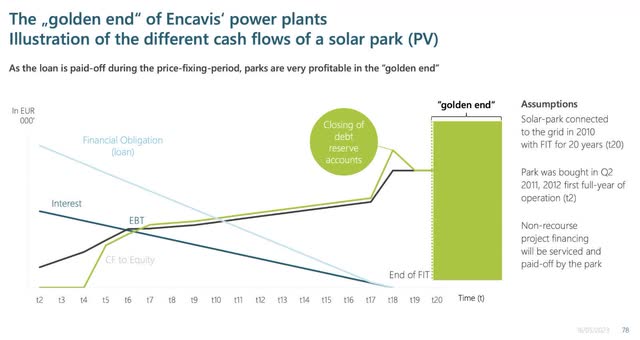
Current Situation
Since 2014, Encavis has increased its Sales from €77.83 million to €487.34 million. This corresponds to a CAGR of 26.2%. This growth will no longer be achievable in the future, due to the law of large numbers. They have issued a growth plan that forecasts a revenue CAGR of 11.5% until 2027.
Earnings increase with almost constant margins (IR Encavis Factbook)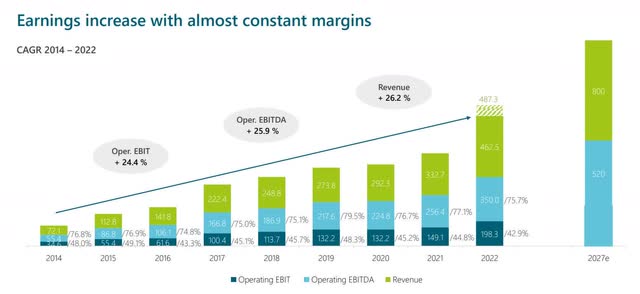
It should be emphasized that Encavis has always been very conservative in its forecasting in the past. The last growth plan (originally intended until 2025) was already fulfilled in 2023 and replaced by a new one (until 2027). Future growth is also expected to come from acquisitions. Encavis currently has a pipeline of 2.6 GWh (at the moment they have a portfolio amounting to 3.4 GWh).
Last quarterly performance
Conference Calls 2023 Conference Calls 2023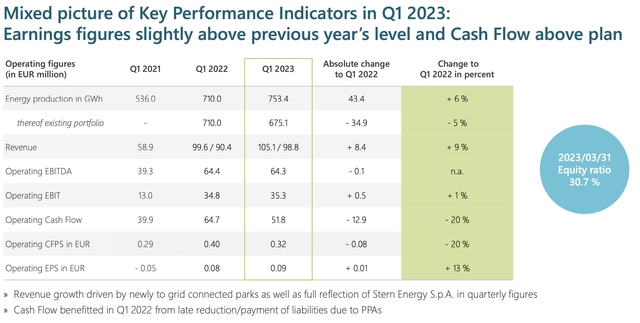
As you can see, the last quarter was quite weak at first glance. The operating cash flow decreased by 20% YoY. However, it must be noted that electricity prices were extremely high and electricity production was very good in 2022. It was clear that there had to be a normalization of the KPI’s, and this is also healthy and natural. Individual quarters can often be over-interpreted in this business area. Wind and sun are not things that can be influenced. Encavis should be viewed on the basis of several quarters, if not several years, in order to smooth out such effects. A long-term view is appropriate here.
Look into the future
Growth ambitions 2027 (Encavis Factbook)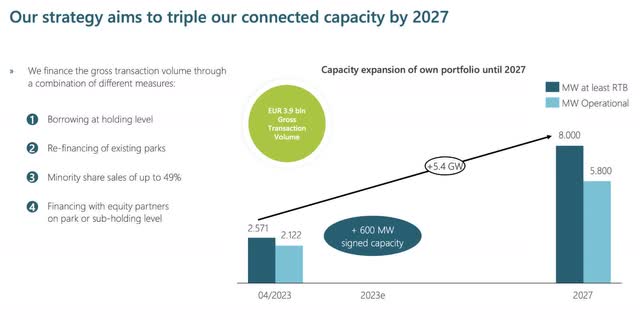
Encavis has set out to triple its electricity production by 2027. That is, of course, an ambitious goal. In the following section, I will examine whether this is realistic and whether I think they can achieve it or perhaps even more.
Growth `27 (Encavis IR)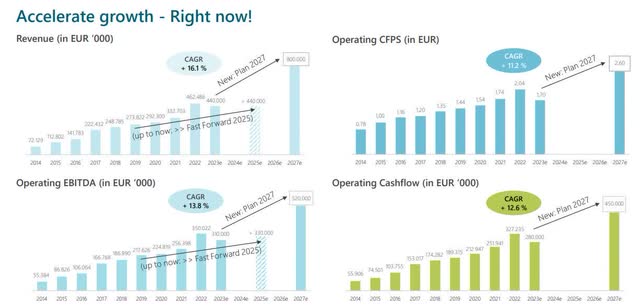
*The sharp increase in 2022 can be explained by the exceptionally high electricity prices in Europe and the very good weather. That this level cannot be maintained is healthy and good.
Increasing production capacity is naturally accompanied by higher profits and cash flows. Above is an illustration of the key figures based on the assumption of growth.
Market volume
Countries with potential (Encavis Factbook)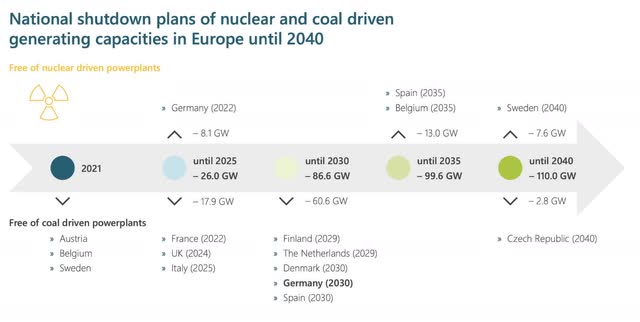
It has long been clear that renewable energies are the future in Europe. Many countries have set firm targets to switch to them. The table above shows when which country wants to do without which energy. Since the electricity consumption of these countries will not decrease, but almost certainly increase, other sources will have to be found. In most countries, wind and solar power will be used. This decision will make more land available for parks in the future, procedures faster and funding larger. Encavis is working closely with developers and governments to take advantage of this shift.
Tailwind from nature
More hours of sunshine (Encavis Factbook)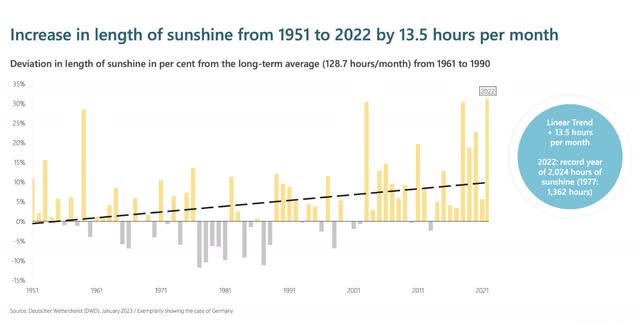
Due to climate change, there is less rain and therefore more sunshine hours in Europe and worldwide. As unfortunate as this is for the planet itself, an operator of solar systems naturally profits from this trend.
Less competition due to higher interest rates
In a German interview, CFO Dr. Christoph Husmann explained that rising interest rates are not having a bad effect on business, as many think. Due to rising interest rates, solar and wind plants are no longer so interesting as a financial instrument for large funds or insurance companies, as the effort is not worthwhile for them. Experienced managers of such parks, like Encavis is, can still generate great returns even with more expensive financing. By reducing the size of the buyer side, parks become cheaper and come to pretty much the same profitability when you calculate the purchase + financing costs against the cash flow that can be generated.
Financial situation
The acquisition of solar and wind parks is very capital intensive. Therefore, it is important that the company can afford it. Let’s take a deep dive into the balance sheet.
Encavis’s balance Sheet in USD 2018-22 (Annual Report)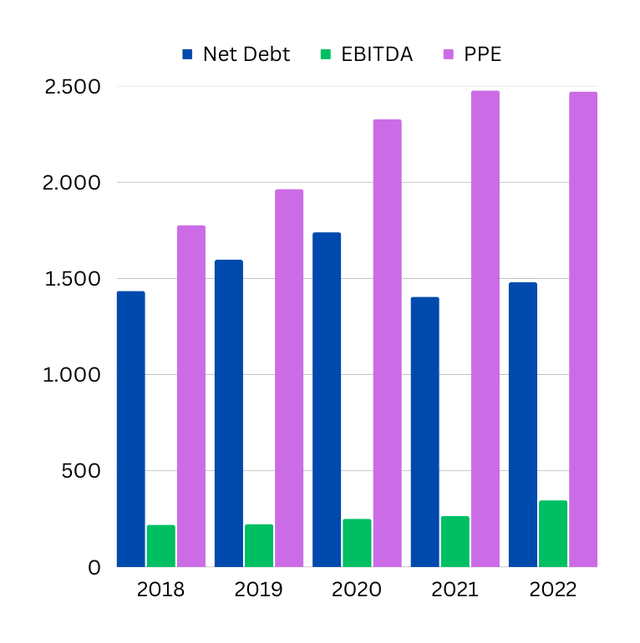
Encavis says it plans to acquire 5.5 GWh of production capacity by 2027. This is expected to cost around €4,000 million. Let’s break down this sum:
- €2,400 million (60%) are to be financed on a project basis (PPAs, ABS). That leaves €1,600 million.
- €200 million are to be financed by minority shareholders (companies that want to finance a park together with Encavis and profit as a minority).
- As for the remaining € 1,400 million, the company wants to finance itself. If we divide this by 5 years (and assume linear growth), we arrive at a value of €280 million.
Let’s compare this with the operating cash flow: Repayment of old loans ~ €150 million + €280 million = €430 million capital required per year.
Cash Flow vs. Investments (Annual Report & Author’s own calculations)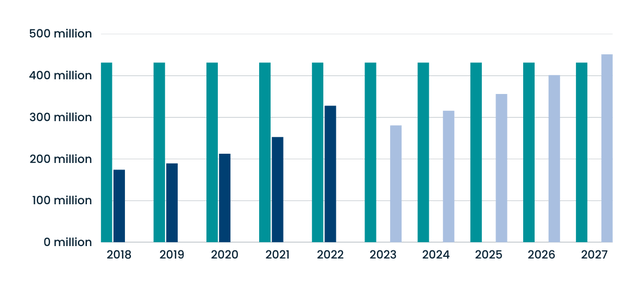
So we can see that debt is still needed, at least for the first few years. For 2023, the required capital has already been collected with a bond issue in February. The Board of Management sees no problem in managing this well for the next few years as well.
It is also interesting to note that these financing options are expected to keep the company’s equity ratio relatively constant at 30%.
| Year | Equity ratio |
| 2018 | 27.1% |
| 2019 | 26.3% |
| 2020 | 26.6% |
|
2021 |
33.2% |
|
2022 |
28.1% |
From a financial point of view, therefore, this is a quite realistic goal.
Dividend
Dividend 2016-2021 (Annual Report)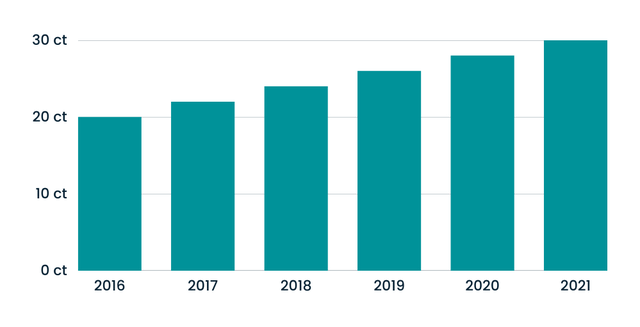
Encavis has paid a steadily increasing dividend since 2016. In the dividend proposal for the 2022 financial year, however, the management is now breaking with tradition. They have proposed to keep the money in the company to finance growth and avoid a capital raising. This has now also been approved at the Annual General Meeting). I think it is a pity that the dividend track record is not maintained, but since it is well justified, it is not a negative point for me.
Shares outstanding
Outstanding Shares (Annual Report 2016-2022)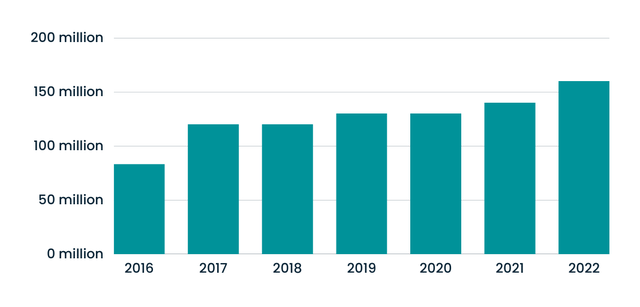
Until now, the company has had to make more frequent capital increases to finance acquisitions. According to management, they should slowly be at a point where existing parks can pay for growth.
Valuation
| Share price | €15.80 | $17.02 |
| Outstanding Shares | 161,030,176 | 161,030,176 |
| Market cap | €2,55 million | $2,750 million |
| Net debt |
€1,355 million |
$1,460 million |
| Enterprise value | €3,905 million | $4,206 million |
| Operating cash flow | €327 million | $352 million |
| EV/OCF | x 11.94 | x 11.94 |
I use the operating cash flow here as it will serve as the basis to finance the future business. In addition, it is not distorted by depreciation and amortization or similar. From the perspective of a long-term investor, this key figure is ideally suited for the company, as it reflects the earnings power of the parks.
If we assume and Encavis generates an OCF of €450 million in 2027 and this is valued at a multiple of 11.94x as today, this would result in a value of €5,373 million. This would represent an annual return of 12.6%.
EV/SALES (Annual Report & Author’s own calculations)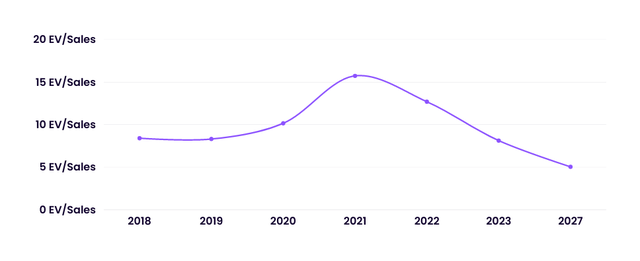
On a revenue basis, Encavis is cheaper than it has been since 2018. And this despite the fact that the financial situation and profitability have improved significantly. 2027 EV/SALES is expected to be 5.04.
DCF Model
Annual Report, Author’s own calculations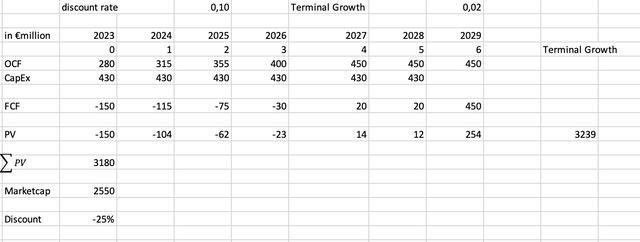
In the following, I will explain and evaluate my DCF model. This model illustrates what would happen if Encavis were to stick to its growth plan until 2027 and then only manage the parks it has already acquired. This provides an overview of the company’s earnings power and serves as a basis for its valuation.
As you can see, I have compared the operating cash flows with the CapEx in order to calculate the free cash flow. I have used the terminal growth rate to grow this by 2% per year (from 2029), as this should represent the long-term price increase. Indicators for this are the targeted inflation rate of the ECB of 2% and the planned annual increase in electricity consumption of 2%. I think that Encavis is quite capable of generating more than 2% only through price increases, but I prefer to estimate conservatively in this model in order to be positively surprised and not negatively.
I set the discount rate at 10%, as that is my expected return. If I provide my capital to a company, that would be a return I try to aim for.
I calculate the present value by adding the discounted cash flows + the terminal value (last discounted free cash flow * terminal growth rate/ (discount rate-terminal growth rate)). I then compare this to Encavis’ current market cap to get a valuation. Currently, Encavis is trading 25% below fair value. I think this is an attractive margin of safety. This model assumes that Encavis does not want to grow further after 2027. I think that is very unlikely. Nevertheless, it provides a good overview of the current valuation.
Peers
| Name | Market Cap | EV / SALES FWD | EV / EBIT FWD |
| Encavis (OTCPK:ENCVF) | $2.75 B | 9.27 | 22.07 |
| NextEra Energy (NEE) | $150 B | 9.15 | 27.57 |
| ReNew Energy Global (RNW) | $2.24 B | 8.41 | 14.79 |
| Brookfield Renewable Partners (BEP) | $14.98 B | 10.53 | 24.67 |
Even when compared to other companies in the industry, it becomes clear Encavis is anything but expensive. In fact, I would argue that Encavis would deserve a premium over the others because they do not have the risks of building the plants.
Risks
Tax increases: In 2022, an additional tax was decided for electricity companies in many parts of Europe. The so-called windfall profits tax. About 10% of Encavis’ sales are not contracted through PPAs and are therefore affected by the tax. Of course, it has to be said that taxes were paid on very high profits, so this is not too bad.
Bad weather: When the sun is not shining or the wind is not blowing, Encavis earns less money. This is something that cannot be influenced. The company itself calculates with standard weather, so there are small surprises in both directions, but in the long-term trend it does not make a big difference.
Interest rates: In the euro zone, interest rates are rising to combat inflation. For a business as capital-intensive as buying and managing power generation assets, such developments are of course not conducive. But it’s not all bad, because the fact that interest rates are rising again means that many institutional investors are withdrawing from the market. This makes the purchase prices for Encavis more favorable again and, according to the management, these two effects offset each other.
Partnerships: Encavis works closely with its project partners. Through this partnership they get the opportunity to acquire parks at good conditions. Should these partnerships ever come to a standstill, this would have a strong impact on the growth of the company. This would have no effect on the current business. I think this is very unrealistic, because Encavis has been working well with most of the partners for years.
Skilled workers: The equipment must be maintained and cleaned. In Germany and other European countries, there is currently a shortage of skilled workers. If Encavis does not manage to hire enough qualified personnel, parks could be maintained or cleaned too late, which would result in lower electricity production.
Conclusion
As an investor with a long investment horizon, I find such a business model extremely interesting. To me, the company appears future-proof, predictable, and very profitable in the long run. Encavis fits well into my investment strategy because they produce a lot of cash and either use that very well for growth or to increase shareholder value. Encavis is well positioned in a great market. The company’s financial position could be a little better, but it is not something I would worry about. The management is very competent and sympathetic. I think Encavis is going to be a lot of fun for long-term investors, and I myself will soon be adding to my existing position. I see enormous opportunities in the new growth strategy in particular, and I also find the stock to be attractively valued. Encavis is a strong buy for me. Currently, Encavis makes up 2% of my portfolio. The lower the price goes, the more I will buy.
Editor’s Note: This article discusses one or more securities that do not trade on a major U.S. exchange. Please be aware of the risks associated with these stocks.
Read the full article here
