Part I – Introduction
Agnico Eagle Mines Limited (NYSE:AEM) is part of the preferred long-term gold miners I have covered quarterly on Seeking Alpha since 2014. The company reported its first quarter 2023 results on April 27, 2023.
Note: This article updates my February 17, 2023 article.
Noticeable most recent acquisitions:
- On February 8, 2022, Agnico Eagle and Kirkland Lake Gold announced the completion of the merger of equals transaction.
- On March 31, 2023, Agnico Eagle and Pan American Silver (PAAS) completed the Yamana Gold acquisition of all AUY assets. The Company owns 100% of the Canadian Malartic mine, 100% of the Wasamac project located in the Abitibi region of Quebec, and several other exploration properties in Ontario and Manitoba.
- On April 6, 2023, AEM announced a 50/50 joint venture agreement with Teck Resources Limited (“Teck”) for the San Nicolás copper-zinc development project in Zacatecas, Mexico.
AEM is now the third-largest gold producer, with a P&P mineral reserve of 49 Au Moz.
AEM Map Presentation May (AEM Presentation)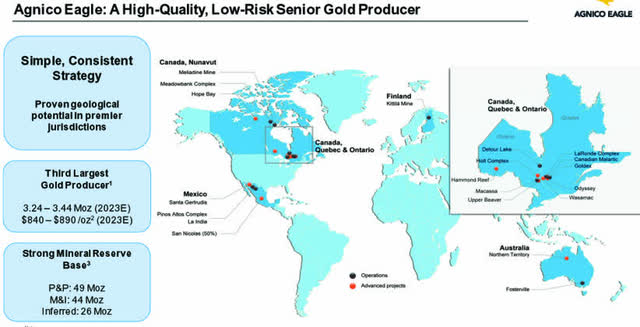
As we see above, Agnico Eagle Mines Limited is growing much bigger through acquisitions, but I wonder if this artificial expansion has benefited AEM shareholders. I am unconvinced, and I believe it may have slowed down the return for long-term shareholders, albeit it could be debated eternally. What do you think?
Ammar Al-Joundi – President and Chief Executive Officer, said in the conference call:
One, strong operational performance, strong production, good costs, good safety, good environmental performance. Two, very good progress on optimizing our assets. 2022 was a year of consolidation, 2023 is going to be a year of optimization. There’s a lot of work, particular focus on the Abitibi belt, but the huge potential. And then three excellent exploration results. Importantly, excellent across a number of assets and Guy will talk about that.
1 – 1Q23 Results Snapshot
AEM posted a net income of $1,816.89 million in 1Q23, or $3.86 per diluted share, compared with $119.08 million, or $0.31, in 1Q22. Adjusted net income was $271.3 million or $0.58 per share. In the press release (emphasis added):
This result includes the following items (net of tax): a remeasurement gain arising from the acquisition of the remaining 50% of the Canadian Malartic complex of $1,543.4 million ($3.29 per share), transaction costs relating to the acquisition of the Canadian assets of Yamana of $12.5 million ($0.03 per share), foreign currency translation gains on deferred tax liabilities of $10.6 million ($0.02 per share), and mark-to-market gains on the Company’s investment portfolio of $4.1 million ($0.01 per share). Excluding the above items results in adjusted net income of $271.3 million or $0.58 per share for the first quarter of 2023.
The company generated revenues of $1,509.66 million this quarter, well over the $1,325.69 million in 1Q22. Revenues were up 9% sequentially.
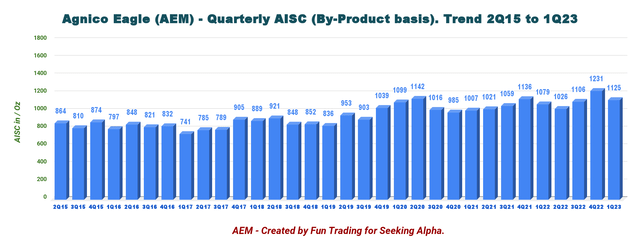
Production in the first quarter of 2023 was 812,813 Au ounces above the 660,604 Au ounces produced last year. All-in-sustaining costs (“AISC”) per ounce was $1,125.
AEM 1Q23 Highlights (AEM Presentation)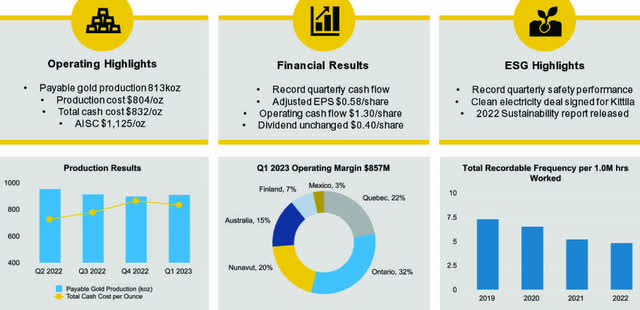
Agnico Eagle indicated 2023-2025 Guidance, including the recent Canadian Malartic portion of Yamana Gold, of excellent and consistent production for the next three years, going from 3,340K Au ounces in 2023 to 3,500K Au ounces in 2025.
AEM guidance (AEM Press Release)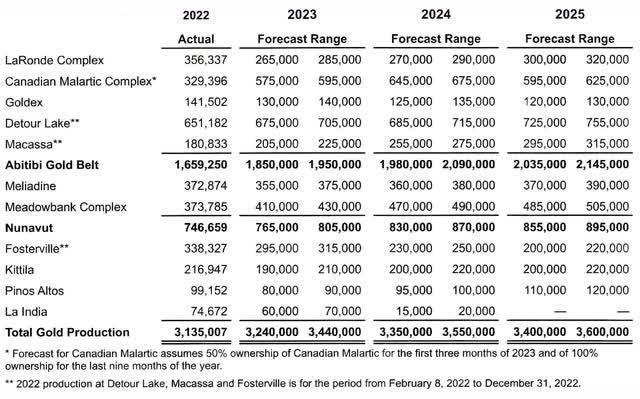
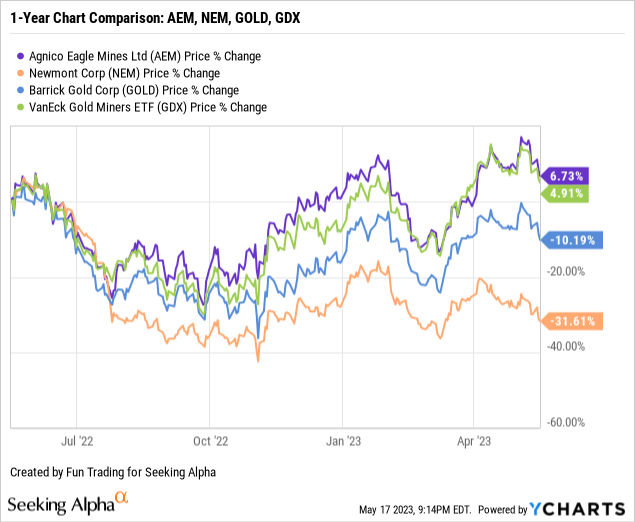
2 – Stock Performance
Agnico Eagle, Newmont Corporation (NEM), and Barrick Gold Corporation (GOLD) have been my preferred long gold miners for years.
As shown below, AEM is up 7% on a one-year basis and has slightly outperformed the group, including the VanEck Gold Miners ETF (GDX).
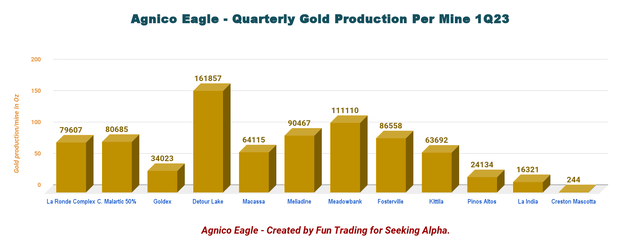
Agnico Eagle presently produces gold from 11 mines with details below:
AEM Quarterly Gold production per Mine 4Q22 versus 1Q23 (Fun Trading)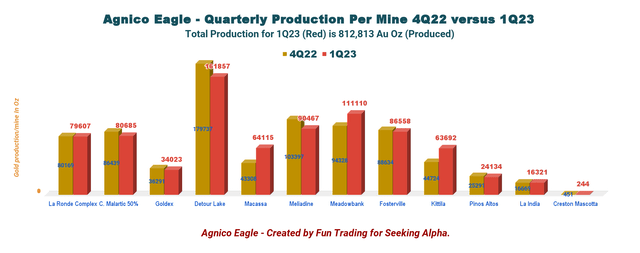
Detour Lake, Macassa, and Fosterville mines are included in the chart above and represent the fourth total quarter production. The Canadian Malartic is still reported at 50% in 1Q23.
3 – Investment Thesis
Agnico Eagle Mines Limited is as excellent a gold miner as we can find. We can’t imagine talking about gold mining and omitting AEM as one of the leading players. Thus, the long-term investment thesis is quite simple here.
As I have said in my preceding articles, I recommend accumulating AEM on any weakness for the long term.
AEM is highly correlated to the gold price. Gold has turned bullish and recently reached nearly $2,050 per ounce due to the FED action.
Initially, the market expected the FED to consider lowering interest rates at the end of 2023, which boosted the gold price. However, the market is now reconsidering this first assumption weakening the gold price slightly.
AEM 1-Year Chart Gold, Silver, Copper (Fun Trading StockCharts)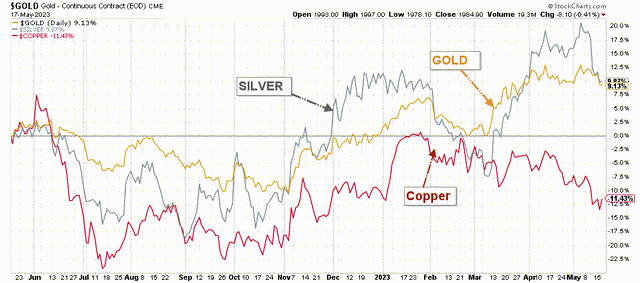
Thus, trading short-term LIFO at a minimum of 40% of your AEM position is crucial.
Agnico Eagle – Financials and Production History Until 1Q23 – The Raw Numbers
| Agnico Eagle | 1Q22 | 2Q22 | 3Q22 | 4Q22 | 1Q23 |
| Total Revenues in $ Million | 1,325.7 | 1,581.1 | 1,449.7 | 1,384.7 | 1,509.7 |
| Net Income in $ Million | 109.8 | 275.9 | 79.6 | 205.0 | 1,816.9 |
| EBITDA $ Million | 458.0 | 747.7 | 518.8 | 547.1 | 2,272.9 |
| EPS diluted in $/share | 0.28 | 0.60 | 0.17 | 0.45 | 3.86 |
| Cash from operations in $ Million | 507.4 | 633.3 | 575.4 | 380.5 | 649.6 |
| Capital Expenditure in $ Million | 293.2 | 408.6 | 435.7 | 400.8 | 384.9 |
| Free Cash Flow in $ Million | 214.3 | 224.7 | 139.8 | -20.3 | 264.7 |
| Total cash $ Billion (including equity securities) | 1.064 | 1.016 | 0.822 | 0.669 | 0.754 |
| Total debt in $ Billion | 1.57 | 1.44 | 1.34 | 1.34 | 2.34 |
| Dividends per quarter in $/ share | 0.40 | 0.40 | 0.40 | 0.40 | 0.40 |
| Shares outstanding diluted in millions | 385.6 | 456.8 | 456.3 | 456.4 | 470.5 |
Source: Company filing and Fun trading.
* Estimated by Fun Trading based on the press release only. Subject to change after the company releases its M&A files.
Part II – Gold Production Details
1 – Gold Production
Agnico Eagle had gold production this quarter. Production was 812,813 Au Oz from 799,438 Au ounces the preceding quarter.
AEM Quarterly Production History (Fun Trading) AEM included three new producing mines (Detour, Fosterville, and Macassa). The 1Q23 is the fourth full quarter of production, combining Agnico Eagle and Kirkland Lake Gold. However, the Canadian Malartic mine is indicated at 50%. AEM Quarterly Production History per Mine in 1Q23 (Fun Trading) All-in sustainable costs, or AISC, were an average of $1,125 per ounce in 1Q23 compared to $1,075 in the prior-year period. Inflationary pressures did not help. AEM Quarterly AISC History (Fun Trading)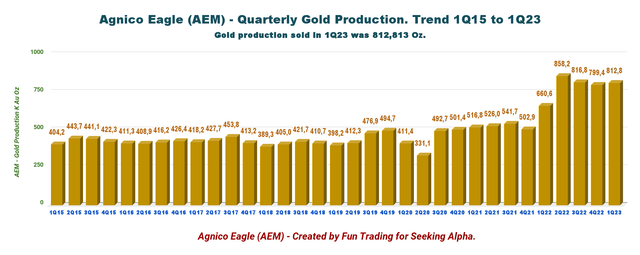
Part III – Balance Sheet Analysis
1 – Revenues of $1,509.7 Million in 1Q23
Agnico Eagle Mines Limited revenues were $1,509.7 million, up 13.9% compared to the same quarter a year ago and up 9% quarter over quarter.
The company posted a $1,816.89 million net income, or $3.86 per diluted share, in the first quarter of 2022. Adjusted net income was $0.58 per share or $271.3 million for the first quarter of 2023.
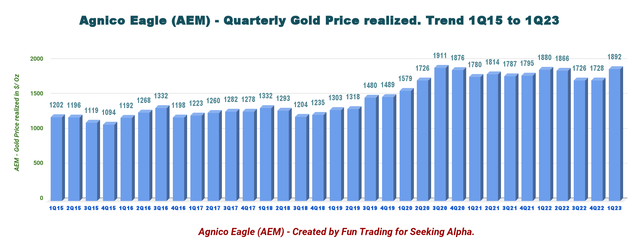
AEM Quarterly Revenue History (Fun Trading) AEM Quarterly Gold Price Realized History (Fun Trading)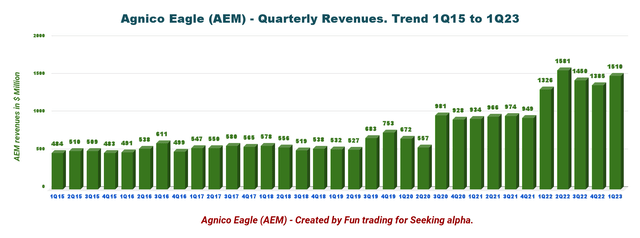
2 – Free Cash Flow was $264.68 Million in 1Q23
The trailing 12-month free cash flow (“FCF”) is estimated at $608.8 million (“TTM”), and the free cash flow for 1Q23 was estimated at $264.68 million.
AEM Quarterly Free Cash Flow History (Fun Trading)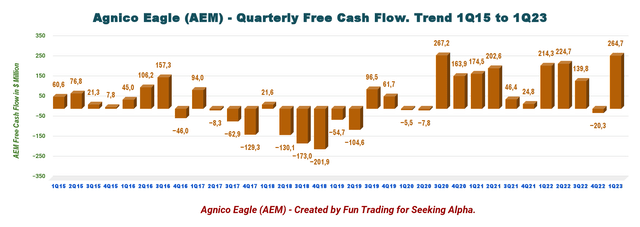
3 – Net Debt was $1,598 Million in 1Q23
Agnico Eagle has solid financials with a net debt of $1,597.9 million, up significantly this quarter.
AEM Quarterly Cash versus Debt History (Fun Trading)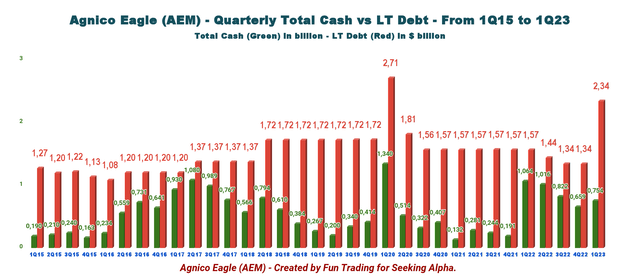
Agnico Eagle had total cash of $754.16 million in 1Q23 compared with $668.52 million as of December 31, 2022. Long-term debt jumped to $2,342.50 million (including current), compared with $1,342.07 million in 4Q22.
The significant change is that AEM drew down $1.0 billion from the unsecured revolving bank credit facility to pay the cash consideration in acquiring the Canadian Assets of Yamana Gold. However, AEM repaid $800 million of the $1 billion withdrawn.
AEM Liquidity Debt (AEM Presentation)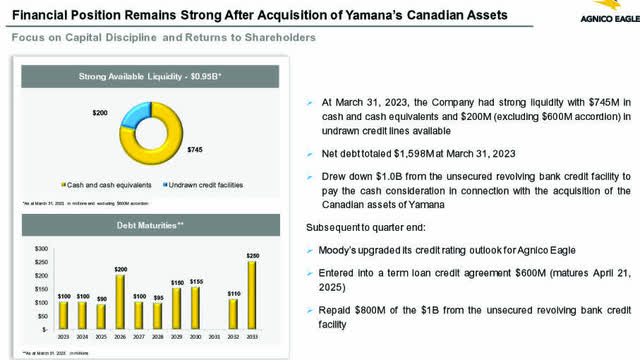
Part IV – Technical Analysis and Commentary
AEM TA Chart Short-term (Fun Trading StockCharts)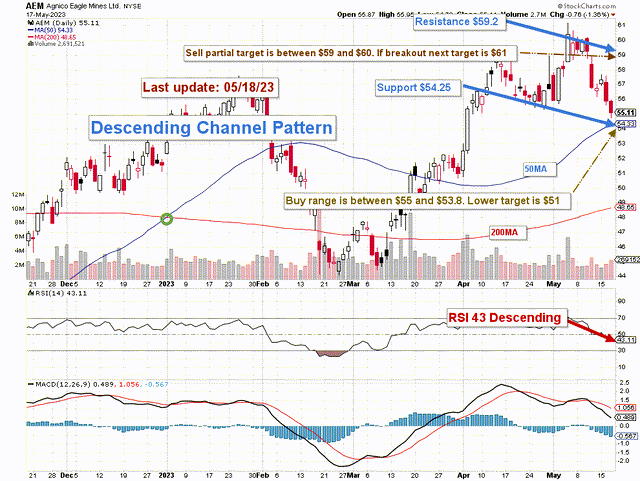
Note: The chart has been adjusted for dividends.
AEM forms a descending channel pattern with resistance at $59.2 and support at $54.25. The RSI is now 43 descending, showing possible further downside ahead.
Descending channel patterns are short-term bearish in that a stock moves lower within a descending channel, but they often form within longer-term uptrends as continuation patterns. The descending channel pattern is often followed by higher prices, but only after an upside penetration of the upper trend line. The stock will continue channeling downward until it is able to break either the upper or lower trend line.
The trading strategy I recommend is to sell Agnico Eagle Mines Limited shares about 40% between $59 and $60 with a potential upper resistance at $61. Conversely, I recommend buying shares between $55 and $53.8, with possible lower support at $51.
The gold price is now retracing a little due to the FED indicating that it will not change its policy in 2023. Look at this period as an excellent opportunity to add on any weaknesses.
Gold retreated on Wednesday as the dollar advanced after hawkish comments from U.S. Federal Reserve officials raised doubts over interest-rate cuts this year.
However, allocating a sizeable portion of your investment in Agnico Eagle Mines Limited is crucial to trade short-term LIFO and taking advantage of the volatility. About 40% is reasonable.
Warning: The TA chart must be updated frequently to be relevant. It is what I am doing in my stock tracker. The chart above has a possible validity of about a week. Remember, the TA chart is a tool only to help you adopt the right strategy. It is not a way to foresee the future. No one and nothing can.
Read the full article here
